1976 United States Senate election in Virginia
| |||||||||||||||||
| Turnout | 47.0%[1] | ||||||||||||||||
|---|---|---|---|---|---|---|---|---|---|---|---|---|---|---|---|---|---|
| |||||||||||||||||
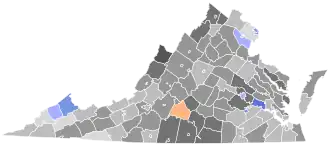 County and independent city results Byrd: 40–50% 50–60% 60–70% 70–80% 80–90% Zumwalt: 40–50% 50–60% 60–70% Perper: 40–50% | |||||||||||||||||
| |||||||||||||||||

| Elections in Virginia |
|---|
 |
The 1976 United States Senate election in Virginia was held on November 2, 1976. Incumbent Senator Harry F. Byrd Jr. was re-elected to a second term over retired Admiral Elmo Zumwalt and state legislator Martin H. Perper. As of 2025, this is the last statewide race in Virginia won by an independent.
General election
Candidates
- Harry F. Byrd Jr., incumbent U.S. Senator (Independent)
- Elmo Zumwalt, former Naval officer and Chief of Naval Operations (Democratic)
- Martin H. Perper, former member of Virginia state legislature (Independent Republican)
Results
| Party | Candidate | Votes | % | ±% | |
|---|---|---|---|---|---|
| Independent | Harry F. Byrd Jr. (incumbent) | 890,778 | 57.19% | +3.65% | |
| Democratic | Elmo Zumwalt | 596,009 | 38.27% | +7.12% | |
| Independent Republican | Martin H. Perper | 70,559 | 4.53% | ||
| Write-ins | 154 | 0.01% | |||
| Majority | 294,769 | 18.93% | −3.45% | ||
| Turnout | 1,557,500 | ||||
| Independent hold | |||||
Results by county or independent city
| Elmo Russell Zumwalt Jr. Democratic |
Harry Flood Byrd Jr. Independent |
Martin Howard Perper Independent Republican |
Various candidates Write-ins |
Margin | Total votes cast | ||||||
|---|---|---|---|---|---|---|---|---|---|---|---|
| # | % | # | % | # | % | # | % | # | % | ||
| Accomack County | 2,574 | 28.89% | 6,023 | 67.59% | 314 | 3.52% | -3,449 | -38.70% | 8,911 | ||
| Albemarle County | 6,074 | 38.26% | 9,288 | 58.50% | 514 | 3.24% | 1 | 0.01% | -3,214 | -20.24% | 15,877 |
| Alleghany County | 1,544 | 36.85% | 2,514 | 60.00% | 132 | 3.15% | -970 | -23.15% | 4,190 | ||
| Amelia County | 978 | 30.91% | 2,095 | 66.21% | 91 | 2.88% | -1,117 | -35.30% | 3,164 | ||
| Amherst County | 2,280 | 31.28% | 4,832 | 66.29% | 177 | 2.43% | -2,552 | -35.01% | 7,289 | ||
| Appomattox County | 866 | 23.55% | 2,649 | 72.02% | 163 | 4.43% | -1,783 | -48.48% | 3,678 | ||
| Arlington County | 30,619 | 50.43% | 27,377 | 45.09% | 2,712 | 4.47% | 6 | 0.01% | 3,242 | 5.34% | 60,714 |
| Augusta County | 3,880 | 28.10% | 8,945 | 64.79% | 980 | 7.10% | 1 | 0.01% | -5,065 | -36.69% | 13,806 |
| Bath County | 415 | 21.67% | 1,418 | 74.05% | 82 | 4.28% | -1,003 | -52.38% | 1,915 | ||
| Bedford County | 3,017 | 34.86% | 5,207 | 60.17% | 430 | 4.97% | -2,190 | -25.31% | 8,654 | ||
| Bland County | 468 | 24.30% | 1,343 | 69.73% | 115 | 5.97% | -875 | -45.43% | 1,926 | ||
| Botetourt County | 2,460 | 35.15% | 4,070 | 58.15% | 465 | 6.64% | 4 | 0.06% | -1,610 | -23.00% | 6,999 |
| Brunswick County | 1,722 | 33.99% | 3,228 | 63.72% | 116 | 2.29% | -1,506 | -29.73% | 5,066 | ||
| Buchanan County | 4,654 | 54.86% | 3,334 | 39.30% | 495 | 5.84% | 1,320 | 15.56% | 8,483 | ||
| Buckingham County | 1,026 | 29.15% | 2,354 | 66.88% | 140 | 3.98% | -1,328 | -37.73% | 3,520 | ||
| Campbell County | 2,274 | 20.70% | 3,385 | 30.81% | 5,326 | 48.48% | -1,941[a] | -17.67% | 10,985 | ||
| Caroline County | 1,939 | 44.81% | 2,208 | 51.03% | 180 | 4.16% | -269 | -6.22% | 4,327 | ||
| Carroll County | 2,566 | 35.59% | 4,229 | 58.66% | 414 | 5.74% | -1,663 | -23.07% | 7,209 | ||
| Charles City County | 1,056 | 60.97% | 558 | 32.22% | 118 | 6.81% | 498 | 28.75% | 1,732 | ||
| Charlotte County | 980 | 23.51% | 3,056 | 73.30% | 133 | 3.19% | -2,076 | -49.80% | 4,169 | ||
| Chesterfield County | 10,778 | 26.05% | 29,382 | 71.01% | 1,211 | 2.93% | 4 | 0.01% | -18,604 | -44.96% | 41,375 |
| Clarke County | 500 | 18.42% | 2,093 | 77.12% | 120 | 4.42% | 1 | 0.04% | -1,593 | -58.70% | 2,714 |
| Craig County | 747 | 45.11% | 860 | 51.93% | 49 | 2.96% | -113 | -6.82% | 1,656 | ||
| Culpeper County | 1,721 | 27.02% | 4,343 | 68.18% | 306 | 4.80% | -2,622 | -41.16% | 6,370 | ||
| Cumberland County | 887 | 37.02% | 1,441 | 60.14% | 68 | 2.84% | -554 | -23.12% | 2,396 | ||
| Dickenson County | 3,387 | 49.32% | 2,622 | 38.18% | 859 | 12.51% | 765 | 11.14% | 6,868 | ||
| Dinwiddie County | 2,238 | 38.05% | 3,519 | 59.83% | 125 | 2.13% | -1,281 | -21.78% | 5,882 | ||
| Essex County | 680 | 27.90% | 1,692 | 69.43% | 65 | 2.67% | -1,012 | -41.53% | 2,437 | ||
| Fairfax County | 89,908 | 46.92% | 90,750 | 47.36% | 10,919 | 5.70% | 38 | 0.02% | -842 | -0.44% | 191,615 |
| Fauquier County | 2,585 | 30.97% | 5,316 | 63.70% | 444 | 5.32% | 1 | 0.01% | -2,731 | -32.72% | 8,346 |
| Floyd County | 1,023 | 30.44% | 2,146 | 63.85% | 192 | 5.71% | -1,123 | -33.41% | 3,361 | ||
| Fluvanna County | 817 | 31.88% | 1,662 | 64.85% | 84 | 3.28% | -845 | -32.97% | 2,563 | ||
| Franklin County | 3,068 | 33.30% | 5,711 | 62.00% | 433 | 4.70% | -2,643 | -28.69% | 9,212 | ||
| Frederick County | 1,849 | 21.72% | 6,153 | 72.29% | 510 | 5.99% | -4,304 | -50.56% | 8,512 | ||
| Giles County | 2,214 | 37.39% | 3,409 | 57.57% | 299 | 5.05% | -1,195 | -20.18% | 5,922 | ||
| Gloucester County | 1,694 | 29.83% | 3,765 | 66.31% | 219 | 3.86% | -2,071 | -36.47% | 5,678 | ||
| Goochland County | 1,651 | 39.52% | 2,448 | 58.59% | 79 | 1.89% | -797 | -19.08% | 4,178 | ||
| Grayson County | 2,094 | 45.49% | 2,272 | 49.36% | 237 | 5.15% | -178 | -3.87% | 4,603 | ||
| Greene County | 594 | 31.56% | 1,164 | 61.85% | 124 | 6.59% | -570 | -30.29% | 1,882 | ||
| Greensville County | 1,471 | 45.75% | 1,701 | 52.91% | 43 | 1.34% | -230 | -7.15% | 3,215 | ||
| Halifax County | 1,725 | 22.78% | 5,409 | 71.42% | 440 | 5.81% | -3,684 | -48.64% | 7,574 | ||
| Hanover County | 4,217 | 24.48% | 12,547 | 72.83% | 462 | 2.68% | 1 | 0.01% | -8,330 | -48.35% | 17,227 |
| Henrico County | 17,724 | 26.69% | 46,576 | 70.13% | 2,108 | 3.17% | 5 | 0.01% | -28,852 | -43.44% | 66,413 |
| Henry County | 5,798 | 42.09% | 7,394 | 53.68% | 583 | 4.23% | -1,596 | -11.59% | 13,775 | ||
| Highland County | 160 | 14.23% | 921 | 81.94% | 43 | 3.83% | -761 | -67.70% | 1,124 | ||
| Isle of Wight County | 2,683 | 40.87% | 3,727 | 56.78% | 154 | 2.35% | -1,044 | -15.90% | 6,564 | ||
| James City County | 2,192 | 38.40% | 3,329 | 58.32% | 187 | 3.28% | -1,137 | -19.92% | 5,708 | ||
| King and Queen County | 525 | 33.00% | 992 | 62.35% | 74 | 4.65% | -467 | -29.35% | 1,591 | ||
| King George County | 845 | 31.04% | 1,702 | 62.53% | 175 | 6.43% | -857 | -31.48% | 2,722 | ||
| King William County | 1,012 | 34.52% | 1,856 | 63.30% | 64 | 2.18% | -844 | -28.79% | 2,932 | ||
| Lancaster County | 1,053 | 27.32% | 2,700 | 70.06% | 101 | 2.62% | -1,647 | -42.73% | 3,854 | ||
| Lee County | 3,285 | 38.95% | 4,424 | 52.45% | 725 | 8.60% | -1,139 | -13.50% | 8,434 | ||
| Loudoun County | 6,178 | 37.29% | 9,487 | 57.26% | 900 | 5.43% | 2 | 0.01% | -3,309 | -19.97% | 16,567 |
| Louisa County | 1,691 | 35.89% | 2,830 | 60.06% | 191 | 4.05% | -1,139 | -24.17% | 4,712 | ||
| Lunenburg County | 893 | 25.51% | 2,476 | 70.72% | 132 | 3.77% | -1,583 | -45.22% | 3,501 | ||
| Madison County | 802 | 25.39% | 2,196 | 69.52% | 161 | 5.10% | -1,394 | -44.13% | 3,159 | ||
| Mathews County | 691 | 23.05% | 2,213 | 73.82% | 94 | 3.14% | -1,522 | -50.77% | 2,998 | ||
| Mecklenburg County | 2,101 | 26.06% | 5,709 | 70.80% | 253 | 3.14% | -3,608 | -44.75% | 8,063 | ||
| Middlesex County | 724 | 26.81% | 1,880 | 69.63% | 96 | 3.56% | -1,156 | -42.81% | 2,700 | ||
| Montgomery County | 5,607 | 37.76% | 8,774 | 59.09% | 467 | 3.15% | -3,167 | -21.33% | 14,848 | ||
| Nelson County | 1,319 | 35.41% | 2,289 | 61.45% | 117 | 3.14% | -970 | -26.04% | 3,725 | ||
| New Kent County | 797 | 31.78% | 1,586 | 63.24% | 125 | 4.98% | -789 | -31.46% | 2,508 | ||
| Northampton County | 1,617 | 38.70% | 2,409 | 57.66% | 152 | 3.64% | -792 | -18.96% | 4,178 | ||
| Northumberland County | 1,024 | 27.63% | 2,529 | 68.24% | 153 | 4.13% | -1,505 | -40.61% | 3,706 | ||
| Nottoway County | 1,438 | 30.45% | 3,106 | 65.78% | 178 | 3.77% | -1,668 | -35.32% | 4,722 | ||
| Orange County | 1,401 | 30.40% | 2,965 | 64.34% | 242 | 5.25% | -1,564 | -33.94% | 4,608 | ||
| Page County | 1,747 | 26.94% | 4,391 | 67.72% | 345 | 5.32% | 1 | 0.02% | -2,644 | -40.78% | 6,484 |
| Patrick County | 1,189 | 27.52% | 2,831 | 65.53% | 300 | 6.94% | -1,642 | -38.01% | 4,320 | ||
| Pittsylvania County | 3,874 | 25.28% | 10,843 | 70.75% | 608 | 3.97% | -6,969 | -45.47% | 15,325 | ||
| Powhatan County | 1,107 | 32.30% | 2,255 | 65.80% | 65 | 1.90% | -1,148 | -33.50% | 3,427 | ||
| Prince Edward County | 1,488 | 30.96% | 3,104 | 64.59% | 214 | 4.45% | -1,616 | -33.62% | 4,806 | ||
| Prince George County | 1,720 | 37.77% | 2,718 | 59.68% | 116 | 2.55% | -998 | -21.91% | 4,554 | ||
| Prince William County | 13,568 | 46.91% | 13,531 | 46.79% | 1,820 | 6.29% | 2 | 0.01% | 37 | 0.13% | 28,921 |
| Pulaski County | 3,569 | 37.74% | 5,481 | 57.96% | 406 | 4.29% | -1,912 | -20.22% | 9,456 | ||
| Rappahannock County | 608 | 30.54% | 1,265 | 63.54% | 118 | 5.93% | -657 | -33.00% | 1,991 | ||
| Richmond County | 452 | 19.83% | 1,771 | 77.71% | 56 | 2.46% | -1,319 | -57.88% | 2,279 | ||
| Roanoke County | 8,134 | 31.80% | 16,396 | 64.09% | 1,051 | 4.11% | -8,262 | -32.30% | 25,581 | ||
| Rockbridge County | 1,396 | 30.53% | 3,024 | 66.13% | 151 | 3.30% | 2 | 0.04% | -1,628 | -35.60% | 4,573 |
| Rockingham County | 4,034 | 27.08% | 10,014 | 67.22% | 849 | 5.70% | -5,980 | -40.14% | 14,897 | ||
| Russell County | 4,415 | 47.48% | 4,514 | 48.55% | 369 | 3.97% | -99 | -1.06% | 9,298 | ||
| Scott County | 3,231 | 41.48% | 4,114 | 52.82% | 443 | 5.69% | 1 | 0.01% | -883 | -11.34% | 7,789 |
| Shenandoah County | 1,942 | 21.07% | 6,791 | 73.70% | 479 | 5.20% | 3 | 0.03% | -4,849 | -52.62% | 9,215 |
| Smyth County | 2,814 | 29.76% | 6,394 | 67.63% | 247 | 2.61% | -3,580 | -37.86% | 9,455 | ||
| Southampton County | 1,567 | 30.30% | 3,486 | 67.40% | 119 | 2.30% | -1,919 | -37.10% | 5,172 | ||
| Spotsylvania County | 2,470 | 35.60% | 4,099 | 59.07% | 369 | 5.32% | 1 | 0.01% | -1,629 | -23.48% | 6,939 |
| Stafford County | 2,981 | 33.18% | 5,510 | 61.32% | 494 | 5.50% | -2,529 | -28.15% | 8,985 | ||
| Surry County | 998 | 39.98% | 1,405 | 56.29% | 93 | 3.73% | -407 | -16.31% | 2,496 | ||
| Sussex County | 1,736 | 46.16% | 1,905 | 50.65% | 120 | 3.19% | -169 | -4.49% | 3,761 | ||
| Tazewell County | 3,961 | 33.82% | 6,186 | 52.82% | 1,564 | 13.35% | -2,225 | -19.00% | 11,711 | ||
| Warren County | 2,177 | 35.79% | 3,607 | 59.31% | 298 | 4.90% | -1,430 | -23.51% | 6,082 | ||
| Washington County | 3,612 | 30.15% | 7,966 | 66.50% | 399 | 3.33% | 2 | 0.02% | -4,354 | -36.35% | 11,979 |
| Westmoreland County | 1,502 | 38.17% | 2,241 | 56.95% | 192 | 4.88% | -739 | -18.78% | 3,935 | ||
| Wise County | 5,195 | 45.91% | 5,653 | 49.96% | 467 | 4.13% | -458 | -4.05% | 11,315 | ||
| Wythe County | 2,361 | 32.62% | 4,508 | 62.28% | 369 | 5.10% | -2,147 | -29.66% | 7,238 | ||
| York County | 3,150 | 32.37% | 6,307 | 64.81% | 275 | 2.83% | -3,157 | -32.44% | 9,732 | ||
| Alexandria City | 19,502 | 56.49% | 13,250 | 38.38% | 1,765 | 5.11% | 7 | 0.02% | 6,252 | 18.11% | 34,524 |
| Bedford City | 847 | 40.74% | 1,197 | 57.58% | 35 | 1.68% | -350 | -16.84% | 2,079 | ||
| Bristol City | 1,663 | 29.30% | 3,887 | 68.48% | 126 | 2.22% | -2,224 | -39.18% | 5,676 | ||
| Buena Vista City | 533 | 32.52% | 1,058 | 64.55% | 48 | 2.93% | -525 | -32.03% | 1,639 | ||
| Charlottesville City | 5,849 | 44.70% | 6,893 | 52.68% | 333 | 2.54% | 10 | 0.08% | -1,044 | -7.98% | 13,085 |
| Chesapeake City | 11,214 | 39.23% | 16,402 | 57.38% | 966 | 3.38% | 1 | 0.00% | -5,188 | -18.15% | 28,583 |
| Clifton Forge City | 599 | 35.19% | 1,039 | 61.05% | 64 | 3.76% | -440 | -25.85% | 1,702 | ||
| Colonial Heights City | 1,671 | 25.75% | 4,504 | 69.40% | 315 | 4.85% | -2,833 | -43.65% | 6,490 | ||
| Covington City | 1,172 | 41.37% | 1,523 | 53.76% | 138 | 4.87% | -351 | -12.39% | 2,833 | ||
| Danville City | 3,313 | 23.26% | 10,313 | 72.40% | 619 | 4.35% | -7,000 | -49.14% | 14,245 | ||
| Emporia City | 530 | 29.20% | 1,261 | 69.48% | 24 | 1.32% | -731 | -40.28% | 1,815 | ||
| Fairfax City | 3,322 | 44.54% | 3,672 | 49.24% | 461 | 6.18% | 3 | 0.04% | -350 | -4.69% | 7,458 |
| Falls Church City | 1,992 | 46.41% | 2,076 | 48.37% | 224 | 5.22% | -84 | -1.96% | 4,292 | ||
| Franklin City | 635 | 30.93% | 1,365 | 66.49% | 53 | 2.58% | -730 | -35.56% | 2,053 | ||
| Fredericksburg City | 1,824 | 38.02% | 2,831 | 59.02% | 142 | 2.96% | -1,007 | -20.99% | 4,797 | ||
| Galax City | 846 | 42.26% | 1,095 | 54.70% | 61 | 3.05% | -249 | -12.44% | 2,002 | ||
| Hampton City | 14,134 | 43.27% | 17,212 | 52.69% | 1,320 | 4.04% | 1 | 0.00% | -3,078 | -9.42% | 32,667 |
| Harrisonburg City | 1,418 | 28.80% | 3,242 | 65.85% | 262 | 5.32% | 1 | 0.02% | -1,824 | -37.05% | 4,923 |
| Hopewell City | 2,655 | 37.72% | 4,124 | 58.59% | 260 | 3.69% | -1,469 | -20.87% | 7,039 | ||
| Lexington City | 671 | 35.22% | 1,204 | 63.20% | 30 | 1.57% | -533 | -27.98% | 1,905 | ||
| Lynchburg City | 6,850 | 30.79% | 14,602 | 65.64% | 788 | 3.54% | 5 | 0.02% | -7,752 | -34.85% | 22,245 |
| Manassas City | 1,412 | 41.43% | 1,803 | 52.90% | 191 | 5.60% | 2 | 0.06% | -391 | -11.47% | 3,408 |
| Manassas Park City | 517 | 48.68% | 489 | 46.05% | 56 | 5.27% | 28 | 2.64% | 1,062 | ||
| Martinsville City | 2,246 | 37.32% | 3,478 | 57.79% | 294 | 4.89% | -1,232 | -20.47% | 6,018 | ||
| Newport News City | 15,897 | 38.71% | 24,307 | 59.18% | 864 | 2.10% | 2 | 0.00% | -8,410 | -20.48% | 41,070 |
| Norfolk City | 29,751 | 46.82% | 31,533 | 49.62% | 2,263 | 3.56% | 2 | 0.00% | -1,782 | -2.80% | 63,549 |
| Norton City | 496 | 39.43% | 712 | 56.60% | 50 | 3.97% | -216 | -17.17% | 1,258 | ||
| Petersburg City | 5,988 | 50.36% | 5,613 | 47.21% | 289 | 2.43% | 375 | 3.15% | 11,890 | ||
| Poquoson City | 476 | 18.93% | 1,991 | 79.17% | 47 | 1.87% | 1 | 0.04% | -1,515 | -60.24% | 2,515 |
| Radford City | 1,611 | 42.31% | 2,092 | 54.94% | 103 | 2.70% | 2 | 0.05% | -481 | -12.63% | 3,808 |
| Richmond City | 38,256 | 49.00% | 37,697 | 48.28% | 2,098 | 2.69% | 29 | 0.04% | 559 | 0.72% | 78,080 |
| Roanoke City | 13,213 | 39.35% | 18,918 | 56.34% | 1,445 | 4.30% | 3 | 0.01% | -5,705 | -16.99% | 33,579 |
| Salem City | 2,605 | 32.12% | 5,154 | 63.56% | 345 | 4.25% | 5 | 0.06% | -2,549 | -31.43% | 8,109 |
| South Boston City | 522 | 23.55% | 1,632 | 73.61% | 63 | 2.84% | -1,110 | -50.07% | 2,217 | ||
| Staunton City | 2,263 | 31.03% | 4,504 | 61.77% | 523 | 7.17% | 2 | 0.03% | -2,241 | -30.73% | 7,292 |
| Suffolk City | 5,845 | 41.83% | 7,815 | 55.93% | 314 | 2.25% | -1,970 | -14.10% | 13,974 | ||
| Virginia Beach City | 18,504 | 31.68% | 37,621 | 64.42% | 2,277 | 3.90% | 2 | 0.00% | -19,117 | -32.73% | 58,404 |
| Waynesboro City | 1,790 | 32.12% | 3,609 | 64.76% | 174 | 3.12% | -1,819 | -32.64% | 5,573 | ||
| Williamsburg City | 1,110 | 38.24% | 1,711 | 58.94% | 80 | 2.76% | 2 | 0.07% | -601 | -20.70% | 2,903 |
| Winchester City | 1,165 | 18.96% | 4,757 | 77.40% | 223 | 3.63% | 1 | 0.02% | -3,592 | -58.44% | 6,146 |
| Totals | 596,009 | 38.27% | 890,778 | 57.19% | 70,559 | 4.53% | 154 | 0.01% | -294,769 | -18.93% | 1,557,500 |
See also
Notes
- ^ In this county or city where Zumwalt ran third behind both Byrd and Perper, margin given is Byrd vote minus Perper vote and percentage margin Byrd percentage minus Perper percentage.
References
- ^ a b Leip, David. "1976 Senatorial General Election Results – Virginia". US Election Atlas.
- ^ "VA US Senate – General Election, November 02, 1976". Our Campaigns.