1966 United States Senate election in Virginia
| |||||||||||||||||||||
| |||||||||||||||||||||
 County and independent city results Spong: 30–40% 40–50% 50–60% 60–70% 70–80% 80–90% Ould: 40–50% 50–60% 60–70% 70–80% | |||||||||||||||||||||
| |||||||||||||||||||||

| Elections in Virginia |
|---|
 |
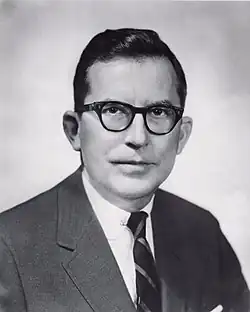
The 1966 United States Senate election in Virginia was held on November 8, 1966. Senator A. Willis Robertson ran for re-election to a fourth term in office but was defeated in the Democratic primary by State Senator William B. Spong Jr. Spong then defeated Republican James Ould and Virginia Conservative F. Lee Hawthorne in the general election.
This was the last time a Democrat won the Class II senate seat from Virginia until 2008. The election was held on the same day as a special election for Virginia's other United States Senate seat.
Democratic primary
Candidates
- A. Willis Robertson, incumbent Senator since 1946
- William B. Spong Jr., State Senator from Portsmouth
Campaign
Senator Robertson had long been one of the most conservative members of the Democratic Party and had opposed most civil rights legislation. To secure his defeat, President Lyndon B. Johnson personally recruited State Senator William B. Spong Jr., a much more liberal member of the party, to challenge Robertson in the Democratic primary.[1] The decaying Byrd machine was unsure about supporting the aging Robertson, with some members favouring younger First District Congressman Thomas Downing.[2] Nevertheless, fears that Downing's supporters would not rally behind Byrd lead the organization to stand with Robertson as its candidate for the primary.
Spong relied on support from newly enfranchised Black voters[3] and the loss of power of such Byrd Democrats as Virginia Beach's Sidney Kellam.[4] He was also helped by Robertson's age and overconfidence amongst his supporters, which may explain why fellow Senator Byrd junior held his place whereas Robertson did not.[5]
Results
| Party | Candidate | Votes | % | |
|---|---|---|---|---|
| Democratic | William B. Spong Jr. | 216,885 | 50.07% | |
| Democratic | A. Willis Robertson (incumbent) | 216,274 | 49.93% | |
| Write-in | 1 | 0.00% | ||
| Total votes | 433,160 | 100.00% | ||
Spong's extremely narrow 611-vote victory – the margin was 764 votes in the first count[1] – was received as a major upset and heralded an end to the conservative Byrd Organization's dominance in the Virginia Democratic Party,[7] alongside Armistead L. Boothe's close loss to Byrd junior in the primary for Virginia's other Senate seat.[8] Spong was helped by the fact that many conservative voters, after the 1965 gubernatorial election, had already turned to the Republican or Virginia Conservative parties and did not vote in the primary.[7]
Primary results by county and independent city
| Absalom Willis Robertson Democratic |
William Belser Spong Jr. Democratic |
Margin | Total votes cast | ||||
|---|---|---|---|---|---|---|---|
| # | % | # | % | # | % | ||
| Accomack County | 1,790 | 51.70% | 1,672 | 48.30% | 118 | 3.41% | 3,462 |
| Albemarle County | 1,599 | 55.81% | 1,266 | 44.19% | 333 | 11.62% | 2,865 |
| Alleghany County | 442 | 62.87% | 261 | 37.13% | 181 | 25.75% | 703 |
| Amelia County | 909 | 66.11% | 466 | 33.89% | 443 | 32.22% | 1,375 |
| Amherst County | 1,291 | 70.20% | 548 | 29.80% | 743 | 40.40% | 1,839 |
| Appomattox County | 2,556 | 85.34% | 439 | 14.66% | 2,117 | 70.68% | 2,995 |
| Arlington County | 6,113 | 34.53% | 11,591 | 65.47% | -5,478 | -30.94% | 17,704 |
| Augusta County | 1,415 | 69.16% | 631 | 30.84% | 784 | 38.32% | 2,046 |
| Bath County | 262 | 81.62% | 59 | 18.38% | 203 | 63.24% | 321 |
| Bedford County | 1,615 | 73.85% | 572 | 26.15% | 1,043 | 47.69% | 2,187 |
| Bland County | 254 | 60.05% | 169 | 39.95% | 85 | 20.09% | 423 |
| Botetourt County | 588 | 59.76% | 396 | 40.24% | 192 | 19.51% | 984 |
| Brunswick County | 1,776 | 61.03% | 1,134 | 38.97% | 642 | 22.06% | 2,910 |
| Buchanan County | 499 | 31.36% | 1,092 | 68.64% | -593 | -37.27% | 1,591 |
| Buckingham County | 1,578 | 77.81% | 450 | 22.19% | 1,128 | 55.62% | 2,028 |
| Campbell County | 1,730 | 74.70% | 586 | 25.30% | 1,144 | 49.40% | 2,316 |
| Caroline County | 873 | 49.94% | 875 | 50.06% | -2 | -0.11% | 1,748 |
| Carroll County | 166 | 20.72% | 635 | 79.28% | -469 | -58.55% | 801 |
| Charles City County | 222 | 23.20% | 735 | 76.80% | -513 | -53.61% | 957 |
| Charlotte County | 1,323 | 77.01% | 395 | 22.99% | 928 | 54.02% | 1,718 |
| Chesterfield County | 4,837 | 64.02% | 2,718 | 35.98% | 2,119 | 28.05% | 7,555 |
| Clarke County | 911 | 65.49% | 480 | 34.51% | 431 | 30.98% | 1,391 |
| Craig County | 133 | 53.85% | 114 | 46.15% | 19 | 7.69% | 247 |
| Culpeper County | 1,430 | 69.38% | 631 | 30.62% | 799 | 38.77% | 2,061 |
| Cumberland County | 943 | 58.32% | 674 | 41.68% | 269 | 16.64% | 1,617 |
| Dickenson County | 688 | 45.56% | 822 | 54.44% | -134 | -8.87% | 1,510 |
| Dinwiddie County | 1,887 | 67.13% | 924 | 32.87% | 963 | 34.26% | 2,811 |
| Essex County | 594 | 63.46% | 342 | 36.54% | 252 | 26.92% | 936 |
| Fairfax County | 8,531 | 30.06% | 19,848 | 69.94% | -11,317 | -39.88% | 28,379 |
| Fauquier County | 2,076 | 63.70% | 1,183 | 36.30% | 893 | 27.40% | 3,259 |
| Floyd County | 144 | 50.00% | 144 | 50.00% | 0 | 0.00% | 288 |
| Fluvanna County | 453 | 76.78% | 137 | 23.22% | 316 | 53.56% | 590 |
| Franklin County | 1,174 | 59.26% | 807 | 40.74% | 367 | 18.53% | 1,981 |
| Frederick County | 1,647 | 68.03% | 774 | 31.97% | 873 | 36.06% | 2,421 |
| Giles County | 517 | 47.61% | 569 | 52.39% | -52 | -4.79% | 1,086 |
| Gloucester County | 798 | 59.95% | 533 | 40.05% | 265 | 19.91% | 1,331 |
| Goochland County | 1,265 | 60.15% | 838 | 39.85% | 427 | 20.30% | 2,103 |
| Grayson County | 381 | 38.72% | 603 | 61.28% | -222 | -22.56% | 984 |
| Greene County | 126 | 61.17% | 80 | 38.83% | 46 | 22.33% | 206 |
| Greensville County | 1,595 | 54.79% | 1,316 | 45.21% | 279 | 9.58% | 2,911 |
| Halifax County | 2,163 | 77.22% | 638 | 22.78% | 1,525 | 54.44% | 2,801 |
| Hanover County | 2,348 | 66.72% | 1,171 | 33.28% | 1,177 | 33.45% | 3,519 |
| Henrico County | 11,288 | 66.44% | 5,701 | 33.56% | 5,587 | 32.89% | 16,989 |
| Henry County | 928 | 51.84% | 862 | 48.16% | 66 | 3.69% | 1,790 |
| Highland County | 203 | 89.04% | 25 | 10.96% | 178 | 78.07% | 228 |
| Isle of Wight County | 909 | 45.04% | 1,109 | 54.96% | -200 | -9.91% | 2,018 |
| James City County | 555 | 52.01% | 512 | 47.99% | 43 | 4.03% | 1,067 |
| King and Queen County | 446 | 51.44% | 421 | 48.56% | 25 | 2.88% | 867 |
| King George County | 452 | 55.39% | 364 | 44.61% | 88 | 10.78% | 816 |
| King William County | 718 | 60.39% | 471 | 39.61% | 247 | 20.77% | 1,189 |
| Lancaster County | 1,525 | 74.83% | 513 | 25.17% | 1,012 | 49.66% | 2,038 |
| Lee County | 200 | 10.32% | 1,738 | 89.68% | -1,538 | -79.36% | 1,938 |
| Loudoun County | 1,949 | 59.77% | 1,312 | 40.23% | 637 | 19.53% | 3,261 |
| Louisa County | 1,410 | 67.53% | 678 | 32.47% | 732 | 35.06% | 2,088 |
| Lunenburg County | 1,178 | 63.50% | 677 | 36.50% | 501 | 27.01% | 1,855 |
| Madison County | 496 | 71.68% | 196 | 28.32% | 300 | 43.35% | 692 |
| Mathews County | 575 | 64.10% | 322 | 35.90% | 253 | 28.21% | 897 |
| Mecklenburg County | 2,189 | 68.30% | 1,016 | 31.70% | 1,173 | 36.60% | 3,205 |
| Middlesex County | 428 | 69.03% | 192 | 30.97% | 236 | 38.06% | 620 |
| Montgomery County | 882 | 56.72% | 673 | 43.28% | 209 | 13.44% | 1,555 |
| Nansemond County | 1,512 | 39.56% | 2,310 | 60.44% | -798 | -20.88% | 3,822 |
| Nelson County | 705 | 71.50% | 281 | 28.50% | 424 | 43.00% | 986 |
| New Kent County | 328 | 44.87% | 403 | 55.13% | -75 | -10.26% | 731 |
| Northampton County | 993 | 68.06% | 466 | 31.94% | 527 | 36.12% | 1,459 |
| Northumberland County | 759 | 54.96% | 622 | 45.04% | 137 | 9.92% | 1,381 |
| Nottoway County | 1,695 | 66.50% | 854 | 33.50% | 841 | 32.99% | 2,549 |
| Orange County | 1,017 | 66.73% | 507 | 33.27% | 510 | 33.46% | 1,524 |
| Page County | 1,261 | 79.61% | 323 | 20.39% | 938 | 59.22% | 1,584 |
| Patrick County | 612 | 44.80% | 754 | 55.20% | -142 | -10.40% | 1,366 |
| Pittsylvania County | 3,411 | 62.91% | 2,011 | 37.09% | 1,400 | 25.82% | 5,422 |
| Powhatan County | 583 | 54.18% | 493 | 45.82% | 90 | 8.36% | 1,076 |
| Prince Edward County | 2,127 | 63.74% | 1,210 | 36.26% | 917 | 27.48% | 3,337 |
| Prince George County | 980 | 55.65% | 781 | 44.35% | 199 | 11.30% | 1,761 |
| Prince William County | 2,505 | 55.18% | 2,035 | 44.82% | 470 | 10.35% | 4,540 |
| Pulaski County | 763 | 41.40% | 1,080 | 58.60% | -317 | -17.20% | 1,843 |
| Rappahannock County | 816 | 79.77% | 207 | 20.23% | 609 | 59.53% | 1,023 |
| Richmond County | 589 | 66.25% | 300 | 33.75% | 289 | 32.51% | 889 |
| Roanoke County | 2,213 | 59.49% | 1,507 | 40.51% | 706 | 18.98% | 3,720 |
| Rockbridge County | 906 | 78.24% | 252 | 21.76% | 654 | 56.48% | 1,158 |
| Rockingham County | 1,138 | 67.14% | 557 | 32.86% | 581 | 34.28% | 1,695 |
| Russell County | 523 | 29.99% | 1,221 | 70.01% | -698 | -40.02% | 1,744 |
| Scott County | 284 | 21.93% | 1,011 | 78.07% | -727 | -56.14% | 1,295 |
| Shenandoah County | 1,430 | 77.72% | 410 | 22.28% | 1,020 | 55.43% | 1,840 |
| Smyth County | 539 | 37.75% | 889 | 62.25% | -350 | -24.51% | 1,428 |
| Southampton County | 1,272 | 55.40% | 1,024 | 44.60% | 248 | 10.80% | 2,296 |
| Spotsylvania County | 1,130 | 46.69% | 1,290 | 53.31% | -160 | -6.61% | 2,420 |
| Stafford County | 1,187 | 44.04% | 1,508 | 55.96% | -321 | -11.91% | 2,695 |
| Surry County | 843 | 52.46% | 764 | 47.54% | 79 | 4.92% | 1,607 |
| Sussex County | 1,686 | 66.88% | 835 | 33.12% | 851 | 33.76% | 2,521 |
| Tazewell County | 770 | 47.71% | 844 | 52.29% | -74 | -4.58% | 1,614 |
| Warren County | 1,246 | 58.55% | 882 | 41.45% | 364 | 17.11% | 2,128 |
| Washington County | 929 | 42.21% | 1,272 | 57.79% | -343 | -15.58% | 2,201 |
| Westmoreland County | 868 | 55.96% | 683 | 44.04% | 185 | 11.93% | 1,551 |
| Wise County | 1,471 | 50.24% | 1,457 | 49.76% | 14 | 0.48% | 2,928 |
| Wythe County | 650 | 46.26% | 755 | 53.74% | -105 | -7.47% | 1,405 |
| York County | 1,206 | 53.10% | 1,065 | 46.90% | 141 | 6.21% | 2,271 |
| Alexandria City | 3,870 | 35.02% | 7,180 | 64.98% | -3,310 | -29.95% | 11,050 |
| Bristol City | 556 | 38.40% | 892 | 61.60% | -336 | -23.20% | 1,448 |
| Buena Vista City | 416 | 79.24% | 109 | 20.76% | 307 | 58.48% | 525 |
| Charlottesville City | 2,123 | 46.49% | 2,444 | 53.51% | -321 | -7.03% | 4,567 |
| Chesapeake City | 4,820 | 43.44% | 6,277 | 56.56% | -1,457 | -13.13% | 11,097 |
| Clifton Forge City | 401 | 69.26% | 178 | 30.74% | 223 | 38.51% | 579 |
| Colonial Heights City | 1,478 | 80.02% | 369 | 19.98% | 1,109 | 60.04% | 1,847 |
| Covington City | 575 | 59.28% | 395 | 40.72% | 180 | 18.56% | 970 |
| Danville City | 2,691 | 60.01% | 1,793 | 39.99% | 898 | 20.03% | 4,484 |
| Fairfax City | 773 | 36.39% | 1,351 | 63.61% | -578 | -27.21% | 2,124 |
| Falls Church City | 441 | 31.34% | 966 | 68.66% | -525 | -37.31% | 1,407 |
| Franklin City | 536 | 55.66% | 427 | 44.34% | 109 | 11.32% | 963 |
| Fredericksburg City | 1,406 | 45.17% | 1,707 | 54.83% | -301 | -9.67% | 3,113 |
| Galax City | 182 | 40.27% | 270 | 59.73% | -88 | -19.47% | 452 |
| Hampton City | 5,335 | 50.50% | 5,229 | 49.49% | 106 | 1.00% | 10,565[a] |
| Harrisonburg City | 844 | 70.22% | 358 | 29.78% | 486 | 40.43% | 1,202 |
| Hopewell City | 1,376 | 56.05% | 1,079 | 43.95% | 297 | 12.10% | 2,455 |
| Lexington City | 662 | 68.32% | 307 | 31.68% | 355 | 36.64% | 969 |
| Lynchburg City | 3,188 | 59.30% | 2,188 | 40.70% | 1,000 | 18.60% | 5,376 |
| Martinsville City | 811 | 49.72% | 820 | 50.28% | -9 | -0.55% | 1,631 |
| Newport News City | 6,313 | 49.33% | 6,484 | 50.67% | -171 | -1.34% | 12,797 |
| Norfolk City | 9,773 | 33.76% | 19,175 | 66.24% | -9,402 | -32.48% | 28,948 |
| Norton City | 151 | 34.79% | 283 | 65.21% | -132 | -30.41% | 434 |
| Petersburg City | 2,723 | 46.55% | 3,126 | 53.45% | -403 | -6.89% | 5,849 |
| Portsmouth City | 4,460 | 26.79% | 12,187 | 73.21% | -7,727 | -46.42% | 16,647 |
| Radford City | 334 | 50.76% | 324 | 49.24% | 10 | 1.52% | 658 |
| Richmond City | 14,628 | 46.87% | 16,579 | 53.13% | -1,951 | -6.25% | 31,207 |
| Roanoke City | 4,135 | 54.96% | 3,388 | 45.04% | 747 | 9.93% | 7,523 |
| South Boston City | 599 | 79.65% | 153 | 20.35% | 446 | 59.31% | 752 |
| Staunton City | 1,356 | 66.47% | 684 | 33.53% | 672 | 32.94% | 2,040 |
| Suffolk City | 997 | 54.69% | 826 | 45.31% | 171 | 9.38% | 1,823 |
| Virginia Beach City | 6,396 | 42.77% | 8,560 | 57.23% | -2,164 | -14.47% | 14,956 |
| Waynesboro City | 740 | 59.06% | 513 | 40.94% | 227 | 18.12% | 1,253 |
| Williamsburg City | 470 | 45.76% | 557 | 54.24% | -87 | -8.47% | 1,027 |
| Winchester City | 1,795 | 70.70% | 744 | 29.30% | 1,051 | 41.39% | 2,539 |
| Totals | 216,274 | 49.93% | 216,885 | 50.07% | -611 | -0.14% | 433,160 |
General election
Results
| Party | Candidate | Votes | % | ±% | |
|---|---|---|---|---|---|
| Democratic | William B. Spong Jr. | 429,855 | 58.57% | ||
| Republican | James P. Ould, Jr. | 245,681 | 33.48% | N/A | |
| Conservative | F. Lee Hawthorne | 58,251 | 7.94% | N/A | |
| Write-in | 92 | 0.01% | |||
| Majority | 184,174 | 25.10% | −41.93% | ||
| Turnout | 733,879 | ||||
| Democratic hold | |||||
This was the first time since 1948 that the Republicans nominated a candidate for the seat. James P. Ould was mayor of Lynchburg and ran an essentially conservative campaign against the moderately progressive Spong.[10] He was less successful by about 4 percent than the lesser-known Lawrence Traylor in the concurrent election for the state's other Senate seat.[10]
The Virginia Conservative Party was formed by hard-line Byrd Democrats who believed that the pay-as-you-go political system must be reinforced and federal control eliminated throughout the state.[11] Support by several leaders of the machine for Lyndon Johnson in the 1964 presidential election – most critically future party-switching two-time Governor Mills Godwin[12] – angered this group and led it away from even the conservative state Democratic Party.[13] Both Conservative Senate candidates devoted their campaigns to attacking the major parties for refusing to debate such issues as the supposed takeover of schools, inflation due to the "War on Poverty", and judicial appointments that the Conservatives believed responsible for the crime wave of the 1960s.[14]
Results by county or independent city
| William Belser Spong Jr. Democratic |
James P. Ould, Jr. Republican |
F. Lee Hawthorne Virginia Conservative |
Various candidates Write-ins |
Margin | Total votes cast | ||||||
|---|---|---|---|---|---|---|---|---|---|---|---|
| # | % | # | % | # | % | # | % | # | % | ||
| Accomack County | 2,819 | 65.93% | 1,234 | 28.86% | 221 | 5.17% | 2 | 0.05% | 1,585 | 37.07% | 4,276 |
| Albemarle County | 2,539 | 55.91% | 1,797 | 39.57% | 201 | 4.43% | 4 | 0.09% | 742 | 16.34% | 4,541 |
| Alleghany County | 974 | 56.33% | 692 | 40.02% | 63 | 3.64% | 282 | 16.31% | 1,729 | ||
| Amelia County | 1,070 | 57.47% | 219 | 11.76% | 572 | 30.72% | 1 | 0.05% | 498[b] | 26.75% | 1,862 |
| Amherst County | 1,674 | 49.56% | 995 | 29.46% | 709 | 20.99% | 679 | 20.10% | 3,378 | ||
| Appomattox County | 2,147 | 72.29% | 537 | 18.08% | 277 | 9.33% | 9 | 0.30% | 1,610 | 54.21% | 2,970 |
| Arlington County | 21,294 | 60.38% | 12,176 | 34.53% | 1,794 | 5.09% | 1 | 0.00% | 9,118 | 25.86% | 35,265 |
| Augusta County | 2,731 | 45.32% | 3,020 | 50.12% | 275 | 4.56% | -289 | -4.80% | 6,026 | ||
| Bath County | 798 | 59.46% | 501 | 37.33% | 43 | 3.20% | 297 | 22.13% | 1,342 | ||
| Bedford County | 2,031 | 45.02% | 1,536 | 34.05% | 944 | 20.93% | 495 | 10.97% | 4,511 | ||
| Bland County | 741 | 52.04% | 642 | 45.08% | 41 | 2.88% | 99 | 6.95% | 1,424 | ||
| Botetourt County | 1,471 | 47.93% | 1,493 | 48.65% | 105 | 3.42% | -22 | -0.72% | 3,069 | ||
| Brunswick County | 1,802 | 52.60% | 277 | 8.09% | 1,347 | 39.32% | 455[b] | 13.28% | 3,426 | ||
| Buchanan County | 4,007 | 56.33% | 2,806 | 39.44% | 301 | 4.23% | 1,201 | 16.88% | 7,114 | ||
| Buckingham County | 1,755 | 76.01% | 428 | 18.54% | 126 | 5.46% | 1,327 | 57.47% | 2,309 | ||
| Campbell County | 1,990 | 39.34% | 1,823 | 36.04% | 1,245 | 24.61% | 167 | 3.30% | 5,058 | ||
| Caroline County | 2,306 | 73.96% | 527 | 16.90% | 285 | 9.14% | 1,779 | 57.06% | 3,118 | ||
| Carroll County | 1,356 | 27.94% | 3,406 | 70.17% | 92 | 1.90% | -2,050 | -42.23% | 4,854 | ||
| Charles City County | 1,206 | 86.89% | 154 | 11.10% | 28 | 2.02% | 1,052 | 75.79% | 1,388 | ||
| Charlotte County | 1,092 | 46.89% | 490 | 21.04% | 747 | 32.07% | 345[b] | 14.81% | 2,329 | ||
| Chesterfield County | 6,537 | 40.23% | 5,960 | 36.67% | 3,754 | 23.10% | 577 | 3.55% | 16,251 | ||
| Clarke County | 1,267 | 79.14% | 309 | 19.30% | 25 | 1.56% | 958 | 59.84% | 1,601 | ||
| Craig County | 393 | 46.56% | 435 | 51.54% | 16 | 1.90% | -42 | -4.98% | 844 | ||
| Culpeper County | 1,553 | 62.60% | 844 | 34.02% | 84 | 3.39% | 709 | 28.58% | 2,481 | ||
| Cumberland County | 1,005 | 58.60% | 567 | 33.06% | 143 | 8.34% | 438 | 25.54% | 1,715 | ||
| Dickenson County | 3,218 | 53.20% | 2,687 | 44.42% | 144 | 2.38% | 531 | 8.78% | 6,049 | ||
| Dinwiddie County | 2,185 | 69.56% | 329 | 10.47% | 627 | 19.96% | 1,558[b] | 49.60% | 3,141 | ||
| Essex County | 1,297 | 74.97% | 335 | 19.36% | 98 | 5.66% | 962 | 55.61% | 1,730 | ||
| Fairfax County | 36,472 | 59.59% | 22,838 | 37.31% | 1,898 | 3.10% | 1 | 0.00% | 13,634 | 22.27% | 61,209 |
| Fauquier County | 3,272 | 75.32% | 909 | 20.93% | 163 | 3.75% | 2,363 | 54.40% | 4,344 | ||
| Floyd County | 617 | 31.56% | 1,291 | 66.04% | 47 | 2.40% | -674 | -34.48% | 1,955 | ||
| Fluvanna County | 654 | 52.40% | 362 | 29.01% | 232 | 18.59% | 292 | 23.40% | 1,248 | ||
| Franklin County | 1,830 | 58.41% | 1,077 | 34.38% | 226 | 7.21% | 753 | 24.03% | 3,133 | ||
| Frederick County | 2,430 | 65.43% | 1,217 | 32.77% | 67 | 1.80% | 1,213 | 32.66% | 3,714 | ||
| Giles County | 2,004 | 49.64% | 1,904 | 47.16% | 129 | 3.20% | 100 | 2.48% | 4,037 | ||
| Gloucester County | 1,225 | 59.49% | 569 | 27.63% | 265 | 12.87% | 656 | 31.86% | 2,059 | ||
| Goochland County | 1,727 | 66.99% | 478 | 18.54% | 370 | 14.35% | 3 | 0.12% | 1,249 | 48.45% | 2,578 |
| Grayson County | 1,905 | 44.92% | 2,254 | 53.15% | 82 | 1.93% | -349 | -8.23% | 4,241 | ||
| Greene County | 320 | 41.45% | 417 | 54.02% | 35 | 4.53% | -97 | -12.56% | 772 | ||
| Greensville County | 2,123 | 56.16% | 708 | 18.73% | 948 | 25.08% | 1 | 0.03% | 1,175[b] | 31.08% | 3,780 |
| Halifax County | 2,678 | 60.00% | 970 | 21.73% | 815 | 18.26% | 1,708 | 38.27% | 4,463 | ||
| Hanover County | 3,429 | 58.85% | 1,854 | 31.82% | 544 | 9.34% | 1,575 | 27.03% | 5,827 | ||
| Henrico County | 11,453 | 46.09% | 10,609 | 42.70% | 2,779 | 11.18% | 7 | 0.03% | 844 | 3.40% | 24,848 |
| Henry County | 2,113 | 55.42% | 1,406 | 36.87% | 294 | 7.71% | 707 | 18.54% | 3,813 | ||
| Highland County | 352 | 45.30% | 419 | 53.93% | 6 | 0.77% | -67 | -8.62% | 777 | ||
| Isle of Wight County | 1,886 | 62.31% | 463 | 15.30% | 678 | 22.40% | 1,208[b] | 39.91% | 3,027 | ||
| James City County | 908 | 61.14% | 440 | 29.63% | 137 | 9.23% | 468 | 31.52% | 1,485 | ||
| King and Queen County | 1,181 | 78.58% | 210 | 13.97% | 112 | 7.45% | 971 | 64.60% | 1,503 | ||
| King George County | 1,119 | 69.85% | 436 | 27.22% | 46 | 2.87% | 1 | 0.06% | 683 | 42.63% | 1,602 |
| King William County | 1,290 | 73.55% | 343 | 19.56% | 121 | 6.90% | 947 | 53.99% | 1,754 | ||
| Lancaster County | 1,519 | 61.50% | 797 | 32.27% | 154 | 6.23% | 722 | 29.23% | 2,470 | ||
| Lee County | 4,277 | 54.88% | 3,349 | 42.97% | 168 | 2.16% | 928 | 11.91% | 7,794 | ||
| Loudoun County | 3,531 | 69.17% | 1,299 | 25.45% | 275 | 5.39% | 2,232 | 43.72% | 5,105 | ||
| Louisa County | 1,894 | 64.60% | 751 | 25.61% | 287 | 9.79% | 1,143 | 38.98% | 2,932 | ||
| Lunenburg County | 1,447 | 54.32% | 361 | 13.55% | 856 | 32.13% | 591[b] | 22.18% | 2,664 | ||
| Madison County | 692 | 55.67% | 516 | 41.51% | 33 | 2.65% | 2 | 0.16% | 176 | 14.16% | 1,243 |
| Mathews County | 780 | 55.79% | 518 | 37.05% | 100 | 7.15% | 262 | 18.74% | 1,398 | ||
| Mecklenburg County | 2,563 | 56.07% | 877 | 19.19% | 1,131 | 24.74% | 1,432[b] | 31.33% | 4,571 | ||
| Middlesex County | 657 | 57.18% | 281 | 24.46% | 211 | 18.36% | 376 | 32.72% | 1,149 | ||
| Montgomery County | 2,394 | 41.41% | 3,199 | 55.34% | 188 | 3.25% | -805 | -13.92% | 5,781 | ||
| Nansemond County | 3,716 | 70.43% | 804 | 15.24% | 754 | 14.29% | 2 | 0.04% | 2,912 | 55.19% | 5,276 |
| Nelson County | 962 | 66.53% | 347 | 24.00% | 137 | 9.47% | 615 | 42.53% | 1,446 | ||
| New Kent County | 880 | 68.80% | 270 | 21.11% | 129 | 10.09% | 610 | 47.69% | 1,279 | ||
| Northampton County | 1,126 | 58.28% | 688 | 35.61% | 118 | 6.11% | 438 | 22.67% | 1,932 | ||
| Northumberland County | 1,780 | 61.17% | 949 | 32.61% | 181 | 6.22% | 831 | 28.56% | 2,910 | ||
| Nottoway County | 1,882 | 59.05% | 608 | 19.08% | 697 | 21.87% | 1,185[b] | 37.18% | 3,187 | ||
| Orange County | 1,174 | 60.17% | 627 | 32.14% | 150 | 7.69% | 547 | 28.04% | 1,951 | ||
| Page County | 2,399 | 48.42% | 2,463 | 49.71% | 92 | 1.86% | 1 | 0.02% | -64 | -1.29% | 4,955 |
| Patrick County | 1,347 | 60.11% | 750 | 33.47% | 144 | 6.43% | 597 | 26.64% | 2,241 | ||
| Pittsylvania County | 3,869 | 55.41% | 1,581 | 22.64% | 1,529 | 21.90% | 3 | 0.04% | 2,288 | 32.77% | 6,982 |
| Powhatan County | 880 | 54.83% | 223 | 13.89% | 502 | 31.28% | 378[b] | 23.55% | 1,605 | ||
| Prince Edward County | 2,099 | 60.84% | 900 | 26.09% | 451 | 13.07% | 1,199 | 34.75% | 3,450 | ||
| Prince George County | 1,396 | 61.99% | 462 | 20.52% | 394 | 17.50% | 934 | 41.47% | 2,252 | ||
| Prince William County | 4,372 | 63.57% | 1,976 | 28.73% | 527 | 7.66% | 2 | 0.03% | 2,396 | 34.84% | 6,877 |
| Pulaski County | 2,446 | 49.76% | 2,288 | 46.54% | 182 | 3.70% | 158 | 3.21% | 4,916 | ||
| Rappahannock County | 818 | 77.32% | 213 | 20.13% | 27 | 2.55% | 605 | 57.18% | 1,058 | ||
| Richmond County | 1,086 | 67.37% | 432 | 26.80% | 94 | 5.83% | 654 | 40.57% | 1,612 | ||
| Roanoke County | 4,618 | 38.62% | 6,891 | 57.63% | 449 | 3.75% | -2,273 | -19.01% | 11,958 | ||
| Rockbridge County | 897 | 46.91% | 936 | 48.95% | 79 | 4.13% | -39 | -2.04% | 1,912 | ||
| Rockingham County | 2,701 | 43.48% | 3,298 | 53.09% | 211 | 3.40% | 2 | 0.03% | -597 | -9.61% | 6,212 |
| Russell County | 3,670 | 51.63% | 3,254 | 45.78% | 184 | 2.59% | 416 | 5.85% | 7,108 | ||
| Scott County | 3,401 | 44.53% | 4,001 | 52.38% | 236 | 3.09% | -600 | -7.86% | 7,638 | ||
| Shenandoah County | 2,517 | 41.61% | 3,440 | 56.87% | 92 | 1.52% | -923 | -15.26% | 6,049 | ||
| Smyth County | 3,574 | 45.99% | 4,017 | 51.69% | 180 | 2.32% | -443 | -5.70% | 7,771 | ||
| Southampton County | 1,800 | 56.66% | 454 | 14.29% | 921 | 28.99% | 2 | 0.06% | 879[b] | 27.67% | 3,177 |
| Spotsylvania County | 2,685 | 72.47% | 873 | 23.56% | 147 | 3.97% | 1,812 | 48.91% | 3,705 | ||
| Stafford County | 3,004 | 64.35% | 1,496 | 32.05% | 168 | 3.60% | 1,508 | 32.31% | 4,668 | ||
| Surry County | 1,211 | 77.48% | 196 | 12.54% | 155 | 9.92% | 1 | 0.06% | 1,015 | 64.94% | 1,563 |
| Sussex County | 1,890 | 65.42% | 468 | 16.20% | 525 | 18.17% | 6 | 0.21% | 1,365[b] | 47.25% | 2,889 |
| Tazewell County | 3,861 | 55.35% | 2,881 | 41.30% | 233 | 3.34% | 980 | 14.05% | 6,975 | ||
| Warren County | 2,089 | 63.48% | 1,147 | 34.85% | 55 | 1.67% | 942 | 28.62% | 3,291 | ||
| Washington County | 4,230 | 47.35% | 4,460 | 49.93% | 243 | 2.72% | -230 | -2.57% | 8,933 | ||
| Westmoreland County | 2,093 | 73.31% | 630 | 22.07% | 132 | 4.62% | 1,463 | 51.24% | 2,855 | ||
| Wise County | 5,965 | 60.77% | 3,690 | 37.60% | 160 | 1.63% | 2,275 | 23.18% | 9,815 | ||
| Wythe County | 2,394 | 48.43% | 2,365 | 47.85% | 184 | 3.72% | 29 | 0.59% | 4,943 | ||
| York County | 2,161 | 53.54% | 1,516 | 37.56% | 359 | 8.89% | 645 | 15.98% | 4,036 | ||
| Alexandria City | 9,836 | 62.34% | 5,492 | 34.81% | 447 | 2.83% | 3 | 0.02% | 4,344 | 27.53% | 15,778 |
| Bristol City | 2,031 | 64.58% | 1,067 | 33.93% | 47 | 1.49% | 964 | 30.65% | 3,145 | ||
| Buena Vista City | 382 | 51.62% | 328 | 44.32% | 28 | 3.78% | 2 | 0.27% | 54 | 7.30% | 740 |
| Charlottesville City | 3,748 | 59.58% | 2,335 | 37.12% | 206 | 3.27% | 2 | 0.03% | 1,413 | 22.46% | 6,291 |
| Chesapeake City | 8,114 | 61.42% | 2,793 | 21.14% | 2,303 | 17.43% | 5,321 | 40.28% | 13,210 | ||
| Clifton Forge City | 728 | 60.41% | 432 | 35.85% | 45 | 3.73% | 296 | 24.56% | 1,205 | ||
| Colonial Heights City | 1,568 | 55.58% | 843 | 29.88% | 410 | 14.53% | 725 | 25.70% | 2,821 | ||
| Covington City | 1,240 | 60.40% | 736 | 35.85% | 76 | 3.70% | 1 | 0.05% | 504 | 24.55% | 2,053 |
| Danville City | 3,682 | 53.85% | 1,725 | 25.23% | 1,431 | 20.93% | 1,957 | 28.62% | 6,838 | ||
| Fairfax City | 2,014 | 60.77% | 1,159 | 34.97% | 141 | 4.25% | 855 | 25.80% | 3,314 | ||
| Falls Church City | 1,842 | 65.13% | 901 | 31.86% | 85 | 3.01% | 941 | 33.27% | 2,828 | ||
| Franklin City | 772 | 58.35% | 273 | 20.63% | 276 | 20.86% | 2 | 0.15% | 496[b] | 37.49% | 1,323 |
| Fredericksburg City | 2,998 | 73.19% | 995 | 24.29% | 102 | 2.49% | 1 | 0.02% | 2,003 | 48.90% | 4,096 |
| Galax City | 498 | 46.50% | 550 | 51.35% | 23 | 2.15% | -52 | -4.86% | 1,071 | ||
| Hampton City | 9,797 | 66.66% | 3,887 | 26.45% | 1,008 | 6.86% | 5 | 0.03% | 5,910 | 40.21% | 14,697 |
| Harrisonburg City | 1,353 | 51.31% | 1,229 | 46.61% | 55 | 2.09% | 124 | 4.70% | 2,637 | ||
| Hopewell City | 1,850 | 57.05% | 884 | 27.26% | 508 | 15.66% | 1 | 0.03% | 966 | 29.79% | 3,243 |
| Lexington City | 599 | 48.38% | 623 | 50.32% | 16 | 1.29% | -24 | -1.94% | 1,238 | ||
| Lynchburg City | 4,241 | 40.85% | 3,355 | 32.32% | 2,786 | 26.83% | 886 | 8.53% | 10,382 | ||
| Martinsville City | 1,893 | 62.00% | 1,067 | 34.95% | 93 | 3.05% | 826 | 27.06% | 3,053 | ||
| Newport News City | 10,481 | 62.99% | 4,858 | 29.20% | 1,300 | 7.81% | 5,623 | 33.79% | 16,639 | ||
| Norfolk City | 22,091 | 70.52% | 7,407 | 23.65% | 1,826 | 5.83% | 14,684 | 46.88% | 31,324 | ||
| Norton City | 618 | 59.54% | 409 | 39.40% | 11 | 1.06% | 209 | 20.13% | 1,038 | ||
| Petersburg City | 4,903 | 76.59% | 949 | 14.82% | 550 | 8.59% | 3,954 | 61.76% | 6,402 | ||
| Portsmouth City | 13,478 | 78.05% | 2,727 | 15.79% | 1,064 | 6.16% | 10,751 | 62.26% | 17,269 | ||
| Radford City | 1,060 | 46.80% | 1,158 | 51.13% | 47 | 2.08% | -98 | -4.33% | 2,265 | ||
| Richmond City | 28,403 | 71.74% | 8,538 | 21.56% | 2,632 | 6.65% | 21 | 0.05% | 19,865 | 50.17% | 39,594 |
| Roanoke City | 8,147 | 48.92% | 8,000 | 48.04% | 507 | 3.04% | 147 | 0.88% | 16,654 | ||
| South Boston City | 913 | 63.76% | 400 | 27.93% | 119 | 8.31% | 513 | 35.82% | 1,432 | ||
| Staunton City | 2,257 | 53.94% | 1,774 | 42.40% | 153 | 3.66% | 483 | 11.54% | 4,184 | ||
| Suffolk City | 1,507 | 69.32% | 470 | 21.62% | 195 | 8.97% | 2 | 0.09% | 1,037 | 47.70% | 2,174 |
| Virginia Beach City | 11,587 | 68.07% | 4,392 | 25.80% | 1,043 | 6.13% | 7,195 | 42.27% | 17,022 | ||
| Waynesboro City | 1,181 | 40.43% | 1,659 | 56.80% | 81 | 2.77% | -478 | -16.36% | 2,921 | ||
| Williamsburg City | 753 | 61.07% | 420 | 34.06% | 60 | 4.87% | 333 | 27.01% | 1,233 | ||
| Winchester City | 2,297 | 70.44% | 911 | 27.94% | 52 | 1.59% | 1 | 0.03% | 1,386 | 42.50% | 3,261 |
| Totals | 429,855 | 58.57% | 245,681 | 33.48% | 58,251 | 7.94% | 92 | 0.01% | 184,174 | 25.10% | 733,879 |
See also
Notes
References
- ^ a b Crass, Scott (2015). "Pat Robertson's Father: A Long-Time Segregationist Senator from Virginia". Statesmen and Mischief Makers: Officeholders and Their Contributions to History from Kennedy to Reagan. pp. 720–723. ISBN 9781503587632.
- ^ Parr, Patrick Anthony (August 1982). The 1969 Democratic Party Gubernatorial Primary: A Watershed in Virginia Political History (Master of Arts). Old Dominion University. pp. 35–36.
- ^ Levy, Mark R; Kramer, Michael S. (1973). "The Blacks: Overcoming in a New Way". The Ethnic Factor: How America's Minorities Decide Elections. New York City: Simon and Schuster. pp. 52–53.
- ^ Parr (August 1982). The 1969 Democratic Party Gubernatorial Primary (Master of Arts). p. 47.
- ^ Atkinson, Frank B. (2006). The Dynamic Dominion: Realignment and the Rise of Two-Party Competition in Virginia, 1945-1980. Lanham, Maryland: Rowman & Littlefield Publishers. pp. 188–189. ISBN 9780742552081.
- ^ a b "VA Senator – D Primary – June 14, 1966". Our Campaigns.
- ^ a b Milliken, John G. (2023). "The Emergence of the Modern Democratic Party: Bill Spong and the Election of 1966". In Rozell, Mark; Milliken, John G. (eds.). The New Dominion: The Twentieth-Century Elections That Shaped Modern Virginia. ISBN 9780813949727.
- ^ "VA US Senate – Special D Primary, July 12, 1966". Our Campaigns.
- ^ "Statistics of the Congressional Election of November 8, 1966" (PDF). Clerk of the House of Representatives. p. 43.
- ^ a b Bartley, Numan V. (1975). "The Ambiguous Resurgence of the New South". Southern Politics and the Second Reconstruction. Baltimore: Johns Hopkins University Press. p. 142. ISBN 080181667X.
- ^ Parr (August 1982). The 1969 Democratic Party Gubernatorial Primary (Master of Arts). pp. 33–34.
- ^ Sweeney, James R. (1994). "A New Day in the Old Dominion". Virginia Magazine of History and Biography. 102 (3): 307–348.
- ^ Sweeney, James R. (1998). "Southern Strategies". Virginia Magazine of History and Biography. 106 (2). Old Dominion University: 165–200.
- ^ Gaidmore, Gerald P. (1999). The Virginia Conservative Party, 1965-1969 (Master of Arts). Old Dominion University. pp. 100–101.
- ^ "VA US Senate – General Election, November 08, 1966". Our Campaigns.