1970 United States Senate election in Virginia
| |||||||||||||||||||||
| |||||||||||||||||||||
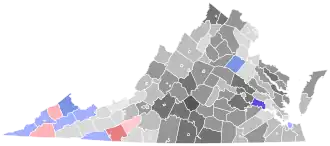 County and independent city results
Byrd: 30-40% 40-50% 50-60% 60-70% 70-80% 80-90% Rawlings: 30-40% 40-50% 50-60% 70-80% Garland: 30-40% 40-50% 50-60% | |||||||||||||||||||||
| |||||||||||||||||||||


| Elections in Virginia |
|---|
 |
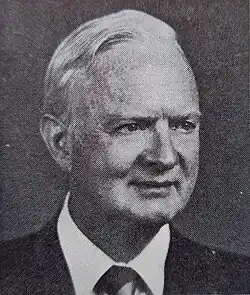
The 1970 United States Senate election in Virginia was held on November 3, 1970. Incumbent Senator Harry F. Byrd Jr. was re-elected to his first full term after winning a race 4 years earlier to finish the remainder of his father's term.
Having switched from Democratic to an Independent shortly before the election, Byrd became the first non-Democrat to represent the state in the Senate since 1889. Byrd dominated the whole state except for the historic "antiorganization" strongholds in unionized coal counties of Southwest Virginia[1] and a few heavily black counties of the Tidewater.
General election
Candidates
- Harry F. Byrd Jr., incumbent U.S. Senator (Independent)
- Ray L. Garland, State Delegate from Roanoke (Republican)
- George C. Rawlings Jr. former State Delegate from Fredericksburg (Democratic)
Results
| Party | Candidate | Votes | % | ±% | ||
|---|---|---|---|---|---|---|
| Independent | Harry F. Byrd Jr. (Incumbent) | 506,237 | 53.54% | +53.54% | ||
| Democratic | George C. Rawlings, Jr. | 294,582 | 31.15% | −22.15% | ||
| Republican | Ray L. Garland | 144,765 | 15.31% | −22.07% | ||
| Write-in | 30 | 0.00% | -0.02% | |||
| Majority | 211,655 | 22.38% | +6.46% | |||
| Turnout | 945,614 | |||||
| Independent gain from Democratic | ||||||
Results by county or independent city
| George C. Rawlings Jr. Democratic |
Ray Lucian Garland Republican |
Harry Flood Byrd Jr. Independent |
Various candidates Write-ins |
Margin[a] | Total votes cast | ||||||
|---|---|---|---|---|---|---|---|---|---|---|---|
| # | % | # | % | # | % | # | % | # | % | ||
| Accomack County | 1,361 | 23.00% | 748 | 12.64% | 3,808 | 64.36% | -2,447 | -41.36% | 5,917 | ||
| Albemarle County | 1,184 | 18.60% | 985 | 15.47% | 4,198 | 65.93% | -3,014 | -47.34% | 6,367 | ||
| Alleghany County | 563 | 23.90% | 515 | 21.86% | 1,278 | 54.24% | -715 | -30.35% | 2,356 | ||
| Amelia County | 622 | 28.53% | 123 | 5.64% | 1,434 | 65.78% | 1 | 0.05% | -812 | -37.25% | 2,180 |
| Amherst County | 931 | 21.72% | 363 | 8.47% | 2,993 | 69.82% | -2,062 | -48.10% | 4,287 | ||
| Appomattox County | 536 | 14.53% | 191 | 5.18% | 2,962 | 80.29% | -2,426 | -65.76% | 3,689 | ||
| Arlington County | 14,270 | 33.05% | 7,607 | 17.62% | 21,302 | 49.33% | -7,032 | -16.29% | 43,179 | ||
| Augusta County | 1,090 | 16.27% | 1,668 | 24.90% | 3,942 | 58.84% | -2,274[b] | -33.94% | 6,700 | ||
| Bath County | 186 | 18.25% | 220 | 21.59% | 613 | 60.16% | -393[b] | -38.57% | 1,019 | ||
| Bedford County | 761 | 16.83% | 464 | 10.26% | 3,296 | 72.90% | -2,535 | -56.07% | 4,521 | ||
| Bland County | 408 | 27.04% | 351 | 23.26% | 750 | 49.70% | -342 | -22.66% | 1,509 | ||
| Botetourt County | 733 | 20.46% | 930 | 25.96% | 1,917 | 53.52% | 2 | 0.06% | -987[b] | -27.56% | 3,582 |
| Brunswick County | 1,291 | 35.78% | 93 | 2.58% | 2,224 | 61.64% | -933 | -25.86% | 3,608 | ||
| Buchanan County | 3,141 | 51.56% | 1,753 | 28.78% | 1,198 | 19.67% | 1,388[c] | 22.78% | 6,092 | ||
| Buckingham County | 863 | 27.57% | 182 | 5.81% | 2,085 | 66.61% | -1,222 | -39.04% | 3,130 | ||
| Campbell County | 811 | 11.68% | 782 | 11.26% | 5,351 | 77.06% | -4,540 | -65.38% | 6,944 | ||
| Caroline County | 1,505 | 46.29% | 153 | 4.71% | 1,593 | 49.00% | -88 | -2.71% | 3,251 | ||
| Carroll County | 1,530 | 31.16% | 2,473 | 50.37% | 907 | 18.47% | -943[c] | -19.21% | 4,910 | ||
| Charles City County | 1,074 | 72.76% | 69 | 4.67% | 333 | 22.56% | 741 | 50.20% | 1,476 | ||
| Charlotte County | 656 | 20.74% | 189 | 5.98% | 2,318 | 73.28% | -1,662 | -52.55% | 3,163 | ||
| Chesterfield County | 2,565 | 16.62% | 1,592 | 10.31% | 11,280 | 73.07% | -8,715 | -56.46% | 15,437 | ||
| Clarke County | 307 | 15.07% | 123 | 6.04% | 1,607 | 78.89% | -1,300 | -63.82% | 2,037 | ||
| Craig County | 240 | 24.95% | 268 | 27.86% | 453 | 47.09% | 1 | 0.10% | -185[b] | -19.23% | 962 |
| Culpeper County | 795 | 23.82% | 468 | 14.02% | 2,075 | 62.16% | -1,280 | -38.35% | 3,338 | ||
| Cumberland County | 810 | 39.78% | 69 | 3.39% | 1,157 | 56.83% | -347 | -17.04% | 2,036 | ||
| Dickenson County | 2,654 | 42.48% | 3,078 | 49.27% | 515 | 8.24% | -424[c] | -6.79% | 6,247 | ||
| Dinwiddie County | 1,209 | 29.14% | 193 | 4.65% | 2,747 | 66.21% | -1,538 | -37.07% | 4,149 | ||
| Essex County | 560 | 33.61% | 74 | 4.44% | 1,032 | 61.94% | -472 | -28.33% | 1,666 | ||
| Fairfax County | 29,259 | 33.16% | 19,707 | 22.33% | 39,278 | 44.51% | -10,019 | -11.35% | 88,244 | ||
| Fauquier County | 1,266 | 26.12% | 558 | 11.51% | 3,023 | 62.37% | -1,757 | -36.25% | 4,847 | ||
| Floyd County | 478 | 21.59% | 869 | 39.25% | 867 | 39.16% | 2[b] | 0.09% | 2,214 | ||
| Fluvanna County | 332 | 22.30% | 147 | 9.87% | 1,010 | 67.83% | -678 | -45.53% | 1,489 | ||
| Franklin County | 1,565 | 33.80% | 668 | 14.43% | 2,397 | 51.77% | -832 | -17.97% | 4,630 | ||
| Frederick County | 1,172 | 20.06% | 403 | 6.90% | 4,268 | 73.04% | -3,096 | -52.99% | 5,843 | ||
| Giles County | 1,541 | 36.81% | 1,016 | 24.27% | 1,629 | 38.92% | -88 | -2.10% | 4,186 | ||
| Gloucester County | 904 | 31.16% | 235 | 8.10% | 1,762 | 60.74% | -858 | -29.58% | 2,901 | ||
| Goochland County | 1,045 | 36.93% | 174 | 6.15% | 1,611 | 56.93% | -566 | -20.00% | 2,830 | ||
| Grayson County | 1,743 | 41.54% | 1,663 | 39.63% | 790 | 18.83% | 80[c] | 1.91% | 4,196 | ||
| Greene County | 193 | 18.45% | 252 | 24.09% | 601 | 57.46% | -349[b] | -33.37% | 1,046 | ||
| Greensville County | 1,054 | 44.74% | 68 | 2.89% | 1,234 | 52.38% | -180 | -7.64% | 2,356 | ||
| Halifax County | 1,223 | 21.45% | 380 | 6.66% | 4,099 | 71.89% | -2,876 | -50.44% | 5,702 | ||
| Hanover County | 1,443 | 18.59% | 567 | 7.30% | 5,754 | 74.11% | -4,311 | -55.53% | 7,764 | ||
| Henrico County | 5,114 | 13.09% | 3,408 | 8.73% | 30,535 | 78.17% | 3 | 0.01% | -25,421 | -65.08% | 39,060 |
| Henry County | 2,954 | 41.00% | 1,036 | 14.38% | 3,215 | 44.62% | -261 | -3.62% | 7,205 | ||
| Highland County | 56 | 7.41% | 255 | 33.73% | 445 | 58.86% | -190[b] | -25.13% | 756 | ||
| Isle of Wight County | 1,627 | 40.41% | 269 | 6.68% | 2,130 | 52.91% | -503 | -12.49% | 4,026 | ||
| James City County | 1,079 | 38.59% | 347 | 12.41% | 1,370 | 49.00% | -291 | -10.41% | 2,796 | ||
| King and Queen County | 575 | 42.81% | 51 | 3.80% | 717 | 53.39% | -142 | -10.57% | 1,343 | ||
| King George County | 571 | 32.15% | 323 | 18.19% | 882 | 49.66% | -311 | -17.51% | 1,776 | ||
| King William County | 617 | 31.85% | 113 | 5.83% | 1,207 | 62.31% | -590 | -30.46% | 1,937 | ||
| Lancaster County | 760 | 25.38% | 267 | 8.92% | 1,967 | 65.70% | -1,207 | -40.31% | 2,994 | ||
| Lee County | 3,024 | 45.39% | 2,325 | 34.90% | 1,313 | 19.71% | 699[c] | 10.49% | 6,662 | ||
| Loudoun County | 1,941 | 26.58% | 945 | 12.94% | 4,417 | 60.48% | -2,476 | -33.90% | 7,303 | ||
| Louisa County | 757 | 25.38% | 212 | 7.11% | 2,014 | 67.52% | -1,257 | -42.14% | 2,983 | ||
| Lunenburg County | 704 | 25.42% | 128 | 4.62% | 1,938 | 69.96% | -1,234 | -44.55% | 2,770 | ||
| Madison County | 314 | 16.66% | 349 | 18.51% | 1,222 | 64.83% | -873[b] | -46.32% | 1,885 | ||
| Mathews County | 443 | 23.60% | 170 | 9.06% | 1,264 | 67.34% | -821 | -43.74% | 1,877 | ||
| Mecklenburg County | 1,502 | 24.63% | 301 | 4.94% | 4,296 | 70.44% | -2,794 | -45.81% | 6,099 | ||
| Middlesex County | 273 | 17.44% | 145 | 9.27% | 1,147 | 73.29% | -874 | -55.85% | 1,565 | ||
| Montgomery County | 1,823 | 22.48% | 1,973 | 24.32% | 4,315 | 53.20% | -2,342[b] | -28.88% | 8,111 | ||
| Nelson County | 369 | 19.39% | 172 | 9.04% | 1,362 | 71.57% | -993 | -52.18% | 1,903 | ||
| New Kent County | 493 | 38.46% | 76 | 5.93% | 713 | 55.62% | -220 | -17.16% | 1,282 | ||
| Northampton County | 994 | 33.73% | 225 | 7.63% | 1,728 | 58.64% | -734 | -24.91% | 2,947 | ||
| Northumberland County | 622 | 25.98% | 169 | 7.06% | 1,603 | 66.96% | -981 | -40.98% | 2,394 | ||
| Nottoway County | 1,093 | 27.87% | 224 | 5.71% | 2,605 | 66.42% | -1,512 | -38.55% | 3,922 | ||
| Orange County | 504 | 18.80% | 305 | 11.38% | 1,871 | 69.79% | 1 | 0.04% | -1,367 | -50.99% | 2,681 |
| Page County | 1,071 | 21.38% | 1,630 | 32.54% | 2,308 | 46.08% | -678[b] | -13.54% | 5,009 | ||
| Patrick County | 796 | 27.99% | 685 | 24.09% | 1,363 | 47.93% | -567 | -19.94% | 2,844 | ||
| Pittsylvania County | 2,981 | 26.61% | 642 | 5.73% | 7,579 | 67.66% | -4,598 | -41.05% | 11,202 | ||
| Powhatan County | 674 | 34.46% | 95 | 4.86% | 1,186 | 60.63% | 1 | 0.05% | -512 | -26.18% | 1,956 |
| Prince Edward County | 1,224 | 29.21% | 230 | 5.49% | 2,736 | 65.30% | -1,512 | -36.09% | 4,190 | ||
| Prince George County | 1,015 | 32.16% | 229 | 7.26% | 1,912 | 60.58% | -897 | -28.42% | 3,156 | ||
| Prince William County | 4,030 | 29.52% | 3,204 | 23.47% | 6,418 | 47.01% | -2,388 | -17.49% | 13,652 | ||
| Pulaski County | 1,730 | 29.63% | 1,468 | 25.15% | 2,640 | 45.22% | -910 | -15.59% | 5,838 | ||
| Rappahannock County | 275 | 23.19% | 107 | 9.02% | 804 | 67.79% | -529 | -44.60% | 1,186 | ||
| Richmond County | 253 | 18.77% | 104 | 7.72% | 991 | 73.52% | -738 | -54.75% | 1,348 | ||
| Roanoke County | 2,426 | 16.42% | 3,396 | 22.98% | 8,955 | 60.59% | 2 | 0.01% | -5,559[b] | -37.61% | 14,779 |
| Rockbridge County | 451 | 17.99% | 428 | 17.07% | 1,627 | 64.90% | 1 | 0.04% | -1,176 | -46.91% | 2,507 |
| Rockingham County | 1,262 | 15.32% | 2,291 | 27.81% | 4,685 | 56.86% | 1 | 0.01% | -2,394[b] | -29.05% | 8,239 |
| Russell County | 2,927 | 41.74% | 2,710 | 38.64% | 1,376 | 19.62% | 217[c] | 3.10% | 7,013 | ||
| Scott County | 2,875 | 38.32% | 3,039 | 40.51% | 1,588 | 21.17% | -164[c] | -2.19% | 7,502 | ||
| Shenandoah County | 881 | 12.70% | 2,566 | 37.00% | 3,489 | 50.30% | -923[b] | -13.30% | 6,936 | ||
| Smyth County | 2,329 | 29.19% | 2,214 | 27.74% | 3,437 | 43.07% | -1,108 | -13.88% | 7,980 | ||
| Southampton County | 1,305 | 33.05% | 165 | 4.18% | 2,479 | 62.78% | -1,174 | -29.73% | 3,949 | ||
| Spotsylvania County | 2,097 | 52.16% | 326 | 8.11% | 1,597 | 39.73% | 500 | 12.44% | 4,020 | ||
| Stafford County | 2,091 | 38.81% | 723 | 13.42% | 2,574 | 47.77% | -483 | -8.96% | 5,388 | ||
| Surry County | 850 | 45.50% | 85 | 4.55% | 933 | 49.95% | -83 | -4.44% | 1,868 | ||
| Sussex County | 1,419 | 39.59% | 99 | 2.76% | 2,066 | 57.65% | -647 | -18.05% | 3,584 | ||
| Tazewell County | 3,054 | 41.99% | 1,545 | 21.24% | 2,674 | 36.77% | 380 | 5.22% | 7,273 | ||
| Warren County | 1,276 | 31.68% | 493 | 12.24% | 2,259 | 56.08% | -983 | -24.40% | 4,028 | ||
| Washington County | 2,683 | 29.77% | 2,525 | 28.02% | 3,804 | 42.21% | -1,121 | -12.44% | 9,012 | ||
| Westmoreland County | 671 | 26.90% | 170 | 6.82% | 1,653 | 66.28% | -982 | -39.37% | 2,494 | ||
| Wise County | 4,703 | 45.78% | 3,757 | 36.58% | 1,811 | 17.63% | 1 | 0.01% | 946[c] | 9.20% | 10,272 |
| Wythe County | 1,099 | 22.66% | 1,463 | 30.16% | 2,287 | 47.15% | 1 | 0.02% | -824[b] | -16.99% | 4,850 |
| York County | 1,598 | 28.41% | 725 | 12.89% | 3,302 | 58.70% | -1,704 | -30.29% | 5,625 | ||
| Alexandria City | 8,091 | 38.50% | 3,645 | 17.34% | 9,280 | 44.16% | -1,189 | -5.66% | 21,016 | ||
| Bedford City | 294 | 19.10% | 208 | 13.52% | 1,037 | 67.38% | -743 | -48.28% | 1,539 | ||
| Bristol City | 957 | 31.89% | 384 | 12.80% | 1,660 | 55.31% | -703 | -23.43% | 3,001 | ||
| Buena Vista City | 170 | 18.78% | 173 | 19.12% | 562 | 62.10% | -389[b] | -42.98% | 905 | ||
| Charlottesville City | 2,691 | 32.02% | 976 | 11.61% | 4,736 | 56.36% | -2,045 | -24.34% | 8,403 | ||
| Chesapeake City | 6,555 | 39.10% | 1,401 | 8.36% | 8,808 | 52.54% | -2,253 | -13.44% | 16,764 | ||
| Clifton Forge City | 269 | 19.81% | 171 | 12.59% | 918 | 67.60% | -649 | -47.79% | 1,358 | ||
| Colonial Heights City | 459 | 12.13% | 351 | 9.28% | 2,974 | 78.59% | -2,515 | -66.46% | 3,784 | ||
| Covington City | 631 | 26.27% | 454 | 18.90% | 1,317 | 54.83% | -686 | -28.56% | 2,402 | ||
| Danville City | 2,631 | 25.69% | 735 | 7.18% | 6,874 | 67.13% | -4,243 | -41.44% | 10,240 | ||
| Emporia City | 479 | 29.57% | 105 | 6.48% | 1,036 | 63.95% | -557 | -34.38% | 1,620 | ||
| Fairfax City | 1,309 | 30.98% | 878 | 20.78% | 2,038 | 48.24% | -729 | -17.26% | 4,225 | ||
| Falls Church City | 1,112 | 35.60% | 553 | 17.70% | 1,459 | 46.70% | -347 | -11.11% | 3,124 | ||
| Franklin City | 489 | 32.38% | 71 | 4.70% | 950 | 62.91% | -461 | -30.53% | 1,510 | ||
| Fredericksburg City | 1,771 | 43.50% | 387 | 9.51% | 1,913 | 46.99% | -142 | -3.49% | 4,071 | ||
| Galax City | 681 | 41.78% | 382 | 23.44% | 567 | 34.79% | 114 | 6.99% | 1,630 | ||
| Hampton City | 8,307 | 41.13% | 2,018 | 9.99% | 9,873 | 48.88% | -1,566 | -7.75% | 20,198 | ||
| Harrisonburg City | 457 | 14.42% | 664 | 20.95% | 2,048 | 64.61% | 1 | 0.03% | -1,384[b] | -43.66% | 3,170 |
| Hopewell City | 1,286 | 27.29% | 382 | 8.11% | 3,045 | 64.61% | -1,759 | -37.32% | 4,713 | ||
| Lexington City | 406 | 27.68% | 261 | 17.79% | 799 | 54.46% | 1 | 0.07% | -393 | -26.79% | 1,467 |
| Lynchburg City | 2,589 | 21.92% | 1,130 | 9.57% | 8,094 | 68.52% | -5,505 | -46.60% | 11,813 | ||
| Martinsville City | 1,818 | 37.79% | 560 | 11.64% | 2,433 | 50.57% | -615 | -12.78% | 4,811 | ||
| Newport News City | 9,622 | 40.51% | 2,177 | 9.17% | 11,948 | 50.31% | 3 | 0.01% | -2,326 | -9.79% | 23,750 |
| Norfolk City | 20,816 | 45.38% | 4,683 | 10.21% | 20,372 | 44.41% | 1 | 0.00% | 444 | 0.97% | 45,872 |
| Norton City | 410 | 39.08% | 327 | 31.17% | 312 | 29.74% | 83[c] | 7.91% | 1,049 | ||
| Petersburg City | 4,025 | 47.84% | 335 | 3.98% | 4,053 | 48.17% | 1 | 0.01% | -28 | -0.33% | 8,414 |
| Portsmouth City | 10,592 | 41.34% | 2,179 | 8.50% | 12,853 | 50.16% | -2,261 | -8.82% | 25,624 | ||
| Radford City | 754 | 27.25% | 768 | 27.76% | 1,245 | 44.99% | -477[b] | -17.23% | 2,767 | ||
| Richmond City | 20,487 | 35.50% | 3,479 | 6.03% | 33,740 | 58.47% | -13,253 | -22.97% | 57,706 | ||
| Roanoke City | 4,443 | 22.32% | 4,016 | 20.18% | 11,443 | 57.49% | 1 | 0.01% | -7,000 | -35.17% | 19,903 |
| Salem City | 864 | 18.29% | 1,016 | 21.50% | 2,843 | 60.17% | 2 | 0.04% | -1,827[b] | -38.67% | 4,725 |
| South Boston City | 319 | 17.56% | 167 | 9.19% | 1,330 | 73.20% | 1 | 0.06% | -1,011 | -55.64% | 1,817 |
| Staunton City | 1,104 | 21.11% | 1,081 | 20.67% | 3,043 | 58.19% | 1 | 0.02% | -1,939 | -37.08% | 5,229 |
| Suffolk City | 617 | 28.03% | 147 | 6.68% | 1,437 | 65.29% | -820 | -37.26% | 2,201 | ||
| Virginia Beach City | 8,434 | 36.02% | 3,192 | 13.63% | 11,787 | 50.34% | 1 | 0.00% | -3,353 | -14.32% | 23,414 |
| Waynesboro City | 732 | 19.15% | 1,042 | 27.26% | 2,048 | 53.58% | -1,006[b] | -26.32% | 3,822 | ||
| Williamsburg City | 613 | 36.29% | 234 | 13.85% | 842 | 49.85% | -229 | -13.56% | 1,689 | ||
| Winchester City | 648 | 17.55% | 157 | 4.25% | 2,887 | 78.20% | -2,239 | -60.64% | 3,692 | ||
| Totals | 294,582 | 31.15% | 144,765 | 15.31% | 506,237 | 53.54% | 30 | 0.00% | -211,655 | -22.38% | 945,614 |
See also
Notes
- ^ Because Byrd won the election as an Independent and Rawlings ran second behind him, all county and city results are Rawlings vote minus Byrd vote unless states otherwise for the county or city in question
- ^ a b c d e f g h i j k l m n o p q r s In this county or city where Rawlings ran third behind both Byrd and Garland, margin given is Garland vote minus Byrd vote and percentage margin Garland percentage minus Byrd percentage.
- ^ a b c d e f g h i In this county or city where Byrd ran third behind Garland and Rawlings, margin given is Rawlings vote minus Garland vote and percentage margin Rawlings percentage minus Garland percentage.
References
- ^ Key, Valdimer Orlando (1949). Southern Politics in State and Nation. New York City: A.A. Knopf. pp. 27–31.
- ^ "Statistics of the Congressional Election of November 3, 1970" (PDF). Clerk of the House of Representatives. p. 35.
- ^ "VA US Senate – General Election, November 03, 1970". Our Campaigns.