2004 Basildon District Council election
| |||||||||||||||||||||||||||||||||||||
14 of the 42 seats to Basildon District Council 22 seats needed for a majority | |||||||||||||||||||||||||||||||||||||
|---|---|---|---|---|---|---|---|---|---|---|---|---|---|---|---|---|---|---|---|---|---|---|---|---|---|---|---|---|---|---|---|---|---|---|---|---|---|
| |||||||||||||||||||||||||||||||||||||
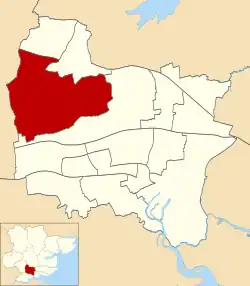
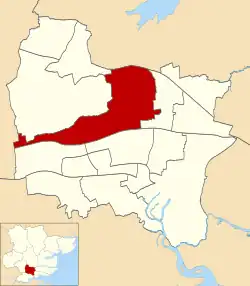
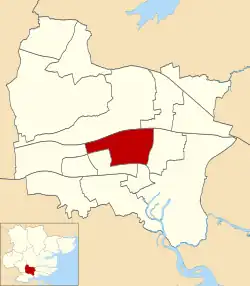
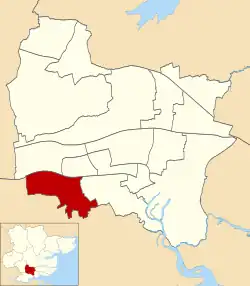
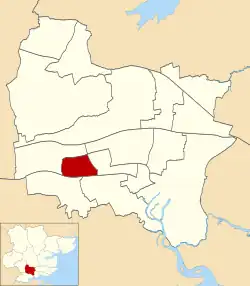
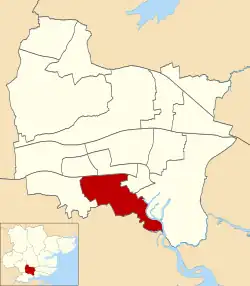
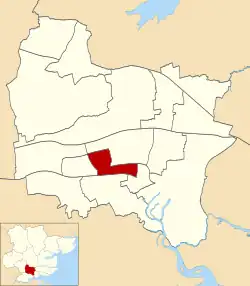
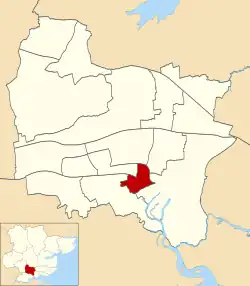
 Map of the results of the 2004 Basildon council election. Conservatives in blue, Labour in red and Liberal Democrats in yellow. Wards in grey were not contested in 2004. | |||||||||||||||||||||||||||||||||||||
| |||||||||||||||||||||||||||||||||||||
The 2004 Basildon District Council election took place on 10 June 2004 to elect members of Basildon District Council in Essex, England. One third of the council was up for election and the Conservative party stayed in overall control of the council.[4]
After the election, the composition of the council was
- Conservative 25
- Labour 14
- Liberal Democrats 3[5]
Election result
| Party | Seats | Gains | Losses | Net gain/loss | Seats % | Votes % | Votes | +/− | |
|---|---|---|---|---|---|---|---|---|---|
| Conservative | 9 | 2 | 0 | 64.3 | 45.2 | 16,536 | |||
| Labour | 4 | 2 | 2 | 28.6 | 23.2 | 8,483 | |||
| Liberal Democrats | 1 | 0 | 0 | 7.1 | 19.0 | 6,960 | |||
| BNP | 0 | 0 | 0 | 0 | 8.2 | 2,983 | |||
| Green | 0 | 0 | 0 | 0 | 1.5 | 566 | |||
| Senior Citizens | 0 | 0 | 0 | 0 | 1.2 | 430 | |||
| English Democrat | 0 | 0 | 0 | 0 | 1.1 | 420 | |||
| Independent | 0 | 0 | 2 | 0.4 | 147 | ||||
| Respect | 0 | 0 | 0 | 0 | 0.2 | 57 | |||
All comparisons in vote share are to the corresponding 2000 election.
Ward results
Billericay East

| Party | Candidate | Votes | % | ±% | |
|---|---|---|---|---|---|
| Conservative | Stuart Sullivan | 2,150 | 65.9 | −0.3 | |
| Liberal Democrats | John James | 780 | 23.9 | +1.6 | |
| Labour | Patricia Reid | 333 | 10.2 | −1.3 | |
| Majority | 1,370 | 42.0 | −1.9 | ||
| Turnout | 3,263 | 36.6 | |||
| Conservative hold | Swing | ||||
Billericay West

| Party | Candidate | Votes | % | ±% | |
|---|---|---|---|---|---|
| Conservative | Philip Turner | 2,345 | 67.9 | −1.6 | |
| Liberal Democrats | Frank Bellard | 821 | 23.8 | +2.9 | |
| Labour | William Archibald | 287 | 8.3 | −1.4 | |
| Majority | 1,524 | 44.1 | −4.5 | ||
| Turnout | 3,453 | 37.3 | |||
| Conservative hold | Swing | ||||
Burstead
| Party | Candidate | Votes | % | ±% | |
|---|---|---|---|---|---|
| Conservative | Richard Moore | 1,935 | 61.7 | +10.1 | |
| Liberal Democrats | Geoffrey Taylor | 837 | 26.7 | −11.7 | |
| Labour | Margaret Viney | 365 | 11.6 | +1.6 | |
| Majority | 1,098 | 35.0 | +21.8 | ||
| Turnout | 3,137 | 37.2 | |||
| Conservative hold | Swing | ||||
Crouch
| Party | Candidate | Votes | % | ±% | |
|---|---|---|---|---|---|
| Conservative | Stuart Allen | 1,121 | 54.1 | ||
| English Democrat | Kim Gandy | 420 | 20.3 | ||
| Labour | Wendy Aitken | 272 | 13.1 | ||
| Liberal Democrats | Vivien Howard | 261 | 12.6 | ||
| Majority | 701 | 33.8 | |||
| Turnout | 2,074 | 34.1 | |||
| Conservative hold | Swing | ||||
Fryerns
| Party | Candidate | Votes | % | ±% | |
|---|---|---|---|---|---|
| Labour | Paul Kirkman | 1,117 | 40.2 | −3.2 | |
| BNP | David King | 601 | 21.6 | −0.3 | |
| Conservative | Kenneth Evens | 584 | 21.0 | +1.8 | |
| Liberal Democrats | John Lutton | 296 | 10.6 | +0.6 | |
| Green | Adam Ellis | 183 | 6.6 | +1.0 | |
| Majority | 516 | 18.6 | −2.9 | ||
| Turnout | 2,781 | 30.0 | |||
| Labour hold | Swing | ||||
Laindon Park

| Party | Candidate | Votes | % | ±% | |
|---|---|---|---|---|---|
| Conservative | Frank Tomlin | 881 | 34.9 | −8.7 | |
| Labour | Anthony Borlase | 716 | 28.3 | −12.0 | |
| BNP | Steven Watts | 509 | 20.2 | +20.2 | |
| Liberal Democrats | Jonathan Myall | 273 | 10.8 | +2.4 | |
| Independent | Alfred Viccary | 147 | 5.8 | +0.8 | |
| Majority | 165 | 6.5 | +3.2 | ||
| Turnout | 2,526 | 30.0 | |||
| Conservative gain from Labour | Swing | ||||
Langdon Hills
| Party | Candidate | Votes | % | ±% | |
|---|---|---|---|---|---|
| Conservative | Stephen Hillier | 1,195 | 54.5 | ||
| Labour | Paul Mitchell | 448 | 20.4 | ||
| Liberal Democrats | Linda Williams | 310 | 14.1 | ||
| Green | Annie Humphries | 238 | 10.9 | ||
| Majority | 747 | 34.1 | |||
| Turnout | 2,191 | 33.8 | |||
| Conservative hold | Swing | ||||
Lee Chapel North
| Party | Candidate | Votes | % | ±% | |
|---|---|---|---|---|---|
| Labour | Lynda Gordon | 996 | 38.6 | −2.0 | |
| Conservative | Terry Fleet | 604 | 23.4 | +0.4 | |
| BNP | Sidney Chaney | 519 | 20.1 | +5.0 | |
| Liberal Democrats | Michael Martin | 261 | 10.1 | −0.9 | |
| Green | Ernest Humphries | 145 | 5.6 | −0.4 | |
| Respect | Richard Duane | 57 | 2.2 | +2.2 | |
| Majority | 392 | 15.2 | −2.4 | ||
| Turnout | 2,582 | 29.8 | |||
| Labour gain from Independent | Swing | ||||
Nethermayne
| Party | Candidate | Votes | % | ±% | |
|---|---|---|---|---|---|
| Liberal Democrats | Geoffrey Williams | 1,459 | 45.5 | −2.6 | |
| Conservative | Harry Tucker | 982 | 30.6 | +6.4 | |
| Labour | Andrew Manning | 766 | 23.9 | −3.8 | |
| Majority | 477 | 14.9 | −5.5 | ||
| Turnout | 3,207 | 37.2 | |||
| Liberal Democrats hold | Swing | ||||
Pitsea North West

| Party | Candidate | Votes | % | ±% | |
|---|---|---|---|---|---|
| Conservative | Andrew Baggott | 838 | 40.2 | +4.8 | |
| Labour | Allan Davies | 789 | 37.8 | −10.5 | |
| Liberal Democrats | Martin Howard | 458 | 22.0 | +5.8 | |
| Majority | 49 | 2.4 | |||
| Turnout | 2,085 | 23.3 | |||
| Conservative gain from Labour | Swing | ||||
Pitsea South East

| Party | Candidate | Votes | % | ±% | |
|---|---|---|---|---|---|
| Conservative | Jacqueline Blake | 1,199 | 44.0 | +7.9 | |
| Labour | Michael Plant | 722 | 26.5 | −7.1 | |
| BNP | Leonard Heather | 526 | 19.3 | +3.8 | |
| Liberal Democrats | Christopher Melanaphy | 275 | 10.1 | +2.2 | |
| Majority | 477 | 17.5 | +15.0 | ||
| Turnout | 2,722 | 30.8 | |||
| Conservative hold | Swing | ||||
St Martin's
| Party | Candidate | Votes | % | ±% | |
|---|---|---|---|---|---|
| Labour | Richard Llewellyn | 592 | 36.6 | −10.4 | |
| BNP | Philip Howell | 434 | 26.8 | +26.8 | |
| Conservative | Deborah Allen | 378 | 23.4 | −5.9 | |
| Liberal Democrats | Stephen Nice | 213 | 13.2 | −1.6 | |
| Majority | 158 | 9.8 | −7.9 | ||
| Turnout | 1,617 | 27.9 | |||
| Labour hold | Swing | ||||
Vange
| Party | Candidate | Votes | % | ±% | |
|---|---|---|---|---|---|
| Labour | Hilary Dyer | 612 | 35.3 | −6.6 | |
| Conservative | Philip Johnson | 502 | 29.0 | −8.4 | |
| BNP | L Stone | 394 | 22.7 | +22.7 | |
| Liberal Democrats | Philip Jenkins | 224 | 12.9 | −0.6 | |
| Majority | 110 | 6.4 | +1.9 | ||
| Turnout | 1,732 | 26.5 | |||
| Labour gain from Independent | Swing | ||||
Wickford North

| Party | Candidate | Votes | % | ±% | |
|---|---|---|---|---|---|
| Conservative | Carole Morris | 1,822 | 56.7 | −6.7 | |
| Liberal Democrats | Fane Cummings | 492 | 15.3 | −0.8 | |
| Labour | Christopher Wilson | 468 | 14.6 | −5.9 | |
| Senior Citizens | David Harrison | 430 | 13.4 | +13.4 | |
| Majority | 1,330 | 41.4 | −1.5 | ||
| Turnout | 3,212 | 34.9 | |||
| Conservative hold | Swing | ||||
References
- ^ "Council compositions by year". The Elections Centre.
- ^ "Local Election Summaries 2004". The Elections Centre.
- ^ "Vote 2004". BBC News.
- ^ "Basildon council". BBC News. Retrieved 27 June 2011.
- ^ a b "Local elections 2004" (PDF). House of Commons Library. Retrieved 28 June 2011.
- ^ a b c d e f g h i j k l m n o "Basildon: Council election results, 10 June". Southend Standard. 11 June 2004. Retrieved 27 June 2011.
- ^ a b c d e f g h i j k l m n o "29.1 Basildon". Local Elections Archive Project. Retrieved 27 June 2011.