1990 Harlow District Council election[ 1] [ 2]
First party
Second party
Third party
Party
Labour
Conservative
Liberal Democrats
Last election
35
4
3
Seats won
14
0
1
Seats after
35
4
3
Seat change
Popular vote
15,278
6,586
3,458
Percentage
59.8%
25.8%
13.5%
Map showing the results of contested wards in the 1990 Harlow District Council elections.
Council control before election Labour
Council control after election Labour
The 1990 Harlow District Council election took place on 3 May 1990 to elect members of Harlow District Council in Essex , England. This was on the same day as other local elections . The Labour Party retained control of the council, which it had held continuously since the council's creation in 1973 .
Election result
1990 Harlow local election result[ 2]
Party
Seats
Gains
Losses
Net gain/loss
Seats %
Votes %
Votes
+/−
Labour
14
0
0
93.3
59.8
15,278
2.0
Liberal Democrats
1
0
0
0.0
13.5
3,458
9.6
Conservative
0
0
0
6.7
25.8
6,586
10.5
HND
0
0
0
0.0
0.8
210
New
All comparisons in vote share are to the corresponding 1986 election .
Ward results
Brays Grove
Location of Brays Grove ward
Hare Street and Town Centre
Location of Hare Street and Town Centre ward
Katherines With Sumner
Location of Katherines with Sumner ward
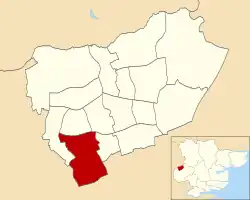
Kingsmoor
Location of Kingsmoor ward
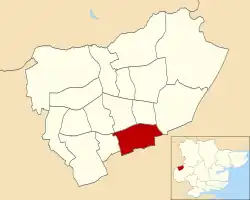
Latton Bush
Location of Latton Bush ward
Little Parndon
Location of Little Parndon ward
Mark Hall North
Location of Mark Hall North ward
Location of Mark Hall South ward
Netteswell West
Location of Netteswell West ward
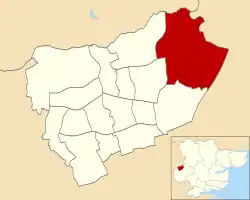
Old Harlow
Location of Old Harlow ward
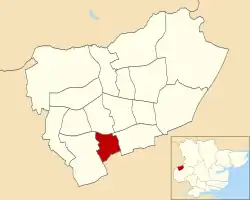
Passmores
Location of Passmores ward
Potter Street
Location of Potter Street ward
Stewards
Location of Stewards ward
Tye Green
Location of Tye Green ward
References