1983 Basildon District Council election
| |||||||||||||||||||||||||||||||||||||||||||||||||||||||||||
14 of the 42 seats to Basildon District Council 22 seats needed for a majority | |||||||||||||||||||||||||||||||||||||||||||||||||||||||||||
|---|---|---|---|---|---|---|---|---|---|---|---|---|---|---|---|---|---|---|---|---|---|---|---|---|---|---|---|---|---|---|---|---|---|---|---|---|---|---|---|---|---|---|---|---|---|---|---|---|---|---|---|---|---|---|---|---|---|---|---|
| |||||||||||||||||||||||||||||||||||||||||||||||||||||||||||
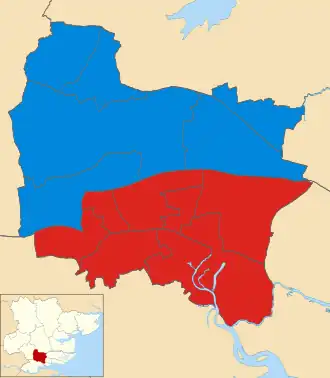 Map showing the results of contested wards in the 1983 Basildon Borough Council elections. | |||||||||||||||||||||||||||||||||||||||||||||||||||||||||||
| |||||||||||||||||||||||||||||||||||||||||||||||||||||||||||
The 1983 Basildon District Council election took place on 5 May 1983 to elect members of Basildon District Council in Essex, England. This was on the same day as other local elections. The Labour Party retained control of the council, which it had won at the previous election in 1982.
Overall results
| Party | Seats | Gains | Losses | Net gain/loss | Seats % | Votes % | Votes | +/− | |
|---|---|---|---|---|---|---|---|---|---|
| Labour | 8 | 2 | 0 | 57.1 | 36.7 | 17,892 | |||
| Conservative | 6 | 3 | 2 | 42.9 | 40.0 | 19,478 | |||
| Alliance | 0 | 0 | 0 | 0.0 | 20.6 | 10,039 | |||
| Residents | 0 | 0 | 3 | 0.0 | 2.7 | 1,295 | |||
| Total | 14 | 48,704 | |||||||
Ward results
Billericay East

| Party | Candidate | Votes | % | |
|---|---|---|---|---|
| Conservative | B. Lea | 2,503 | 63.6% | |
| Alliance | G. Cronkshaw | 819 | 20.8% | |
| Labour | A. Chipperfield | 615 | 15.6% | |
| Turnout | 46.4% | |||
| Conservative gain from Residents | ||||
Billericay West

| Party | Candidate | Votes | % | |
|---|---|---|---|---|
| Conservative | B. Johnson | 2,508 | 66.5% | |
| Alliance | G. Taylor | 902 | 23.9% | |
| Labour | M. Baker | 363 | 9.6% | |
| Turnout | 48.3% | |||
| Conservative gain from Residents | ||||
Burstead
| Party | Candidate | Votes | % | |
|---|---|---|---|---|
| Conservative | G. Parr | 2,025 | 52.6% | |
| Residents | C. Jones | 1,295 | 33.6% | |
| Labour | I. Harlow | 533 | 13.8% | |
| Turnout | 46.1% | |||
| Conservative gain from Residents | ||||
Fryerns Central

| Party | Candidate | Votes | % | |
|---|---|---|---|---|
| Labour | P. Ballard | 2,032 | 50.5% | |
| Alliance | J. White | 1,300 | 32.3% | |
| Conservative | L. Tilt | 693 | 17.2% | |
| Turnout | 44.3% | |||
| Labour hold | ||||
Fryerns East

| Party | Candidate | Votes | % | |
|---|---|---|---|---|
| Labour | A. Dove | 1,766 | 62.5% | |
| Conservative | A. Ball | 718 | 25.4% | |
| Alliance | F. Crow | 340 | 12.0% | |
| Turnout | 34.0% | |||
| Labour hold | ||||
Laindon
| Party | Candidate | Votes | % | |
|---|---|---|---|---|
| Conservative | J. Blerkom | 1,421 | 42.8% | |
| Labour | P. Rackley | 1,364 | 41.1% | |
| Alliance | M. Howard | 532 | 16.0% | |
| Turnout | 44.3% | |||
| Conservative hold | ||||
Langdon Hills

| Party | Candidate | Votes | % | |
|---|---|---|---|---|
| Labour | C. Lynch | 1,071 | 37.2% | |
| Alliance | K. Lack | 978 | 33.9% | |
| Conservative | A. Dines | 832 | 28.9% | |
| Turnout | 39.5% | |||
| Labour hold | ||||
Lee Chapel North

| Party | Candidate | Votes | % | |
|---|---|---|---|---|
| Labour | J. Costello | 1,959 | 60.2% | |
| Conservative | R. Kemp | 731 | 22.5% | |
| Alliance | K. Neil | 564 | 17.3% | |
| Turnout | 40.9% | |||
| Labour hold | ||||
Nethermayne
| Party | Candidate | Votes | % | |
|---|---|---|---|---|
| Labour | E. Gelder | 1,512 | 38.9% | |
| Conservative | P. Cole | 1,322 | 34.0% | |
| Alliance | A. Lutton | 1,057 | 27.2% | |
| Turnout | 48.7% | |||
| Labour gain from Conservative | ||||
Pitsea East
| Party | Candidate | Votes | % | |
|---|---|---|---|---|
| Labour | W. Hodge | 2,106 | 64.7% | |
| Conservative | E. Dines | 1,331 | 39.3% | |
| Alliance | B. Simmons | 442 | 13.0% | |
| Turnout | 40.4% | |||
| Labour gain from Conservative | ||||
Pitsea West

| Party | Candidate | Votes | % | |
|---|---|---|---|---|
| Labour | J. Amey | 2,014 | 62.1% | |
| Conservative | P. Tomkins | 869 | 26.8% | |
| Alliance | A. Scott | 360 | 11.1% | |
| Turnout | 36.9% | |||
| Labour hold | ||||
Vange
| Party | Candidate | Votes | % | |
|---|---|---|---|---|
| Labour | G. Miller | 1,589 | 58.7% | |
| Conservative | J. Dolby | 752 | 27.8% | |
| Alliance | P. Harding | 364 | 13.5% | |
| Turnout | 35.8% | |||
| Labour hold | ||||
Wickford North

| Party | Candidate | Votes | % | |
|---|---|---|---|---|
| Conservative | H. Leibner | 1,998 | 54.8% | |
| Labour | L. Wignall | 1,033 | 28.3% | |
| Alliance | M. Birch | 617 | 16.9% | |
| Turnout | 44.0% | |||
| Conservative hold | ||||
Wickford South
| Party | Candidate | Votes | % | |
|---|---|---|---|---|
| Conservative | T. Ball | 1,775 | 44.8% | |
| Labour | G. Palmer | 1,764 | 44.5% | |
| Alliance | R. Turpin | 425 | 10.7% | |
| Turnout | 49.9% | |||
| Conservative hold | ||||
References
| Metropolitan boroughs |
|
|---|---|
| District councils (England) |
|
| District councils (Wales) |
|
| |