1994 Basildon District Council election
| |||||||||||||||||||||||||||||||||||||
14 of the 42 seats to Basildon District Council 22 seats needed for a majority | |||||||||||||||||||||||||||||||||||||
|---|---|---|---|---|---|---|---|---|---|---|---|---|---|---|---|---|---|---|---|---|---|---|---|---|---|---|---|---|---|---|---|---|---|---|---|---|---|
| |||||||||||||||||||||||||||||||||||||
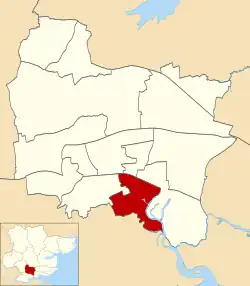
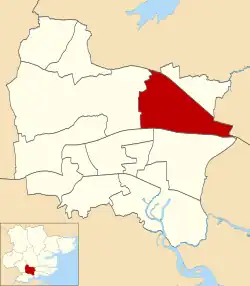
 Map showing the results of contested wards in the 1994 Basildon Borough Council elections. | |||||||||||||||||||||||||||||||||||||
| |||||||||||||||||||||||||||||||||||||
The 1994 Basildon District Council election took place on 5 May 1994 to elect members of Basildon District Council in Essex, England. This was on the same day as other local elections. One third of the council was up for election; the seats which were last contested in 1990. The Conservative Party lost control of the council, which fell under no overall control.
Overall results
| Party | Seats | Gains | Losses | Net gain/loss | Seats % | Votes % | Votes | +/− | |
|---|---|---|---|---|---|---|---|---|---|
| Labour | 8 | 0 | 0 | 57.1 | 41.5 | 22,699 | |||
| Liberal Democrats | 6 | 5 | 0 | 42.9 | 30.0 | 16,405 | |||
| Conservative | 0 | 0 | 5 | 0.0 | 28.2 | 15,407 | |||
| Independent | 0 | 0 | 0 | 0.0 | 0.3 | 144 | New | ||
| Total | 14 | 54,655 | |||||||
All comparisons in vote share are to the corresponding 1990 election.
Ward results
Billericay East

| Party | Candidate | Votes | % | |
|---|---|---|---|---|
| Liberal Democrats | M. Larkin | 2,193 | 53.7% | |
| Conservative | A. Archer | 1,337 | 32.7% | |
| Labour | D. Abrahall | 557 | 13.6% | |
| Turnout | 46.7% | |||
| Liberal Democrats gain from Conservative | ||||
Billericay West

| Party | Candidate | Votes | % | |
|---|---|---|---|---|
| Liberal Democrats | M. Barr | 2,601 | 60.6% | |
| Conservative | J. Bay | 1,344 | 31.3% | |
| Labour | R. Bessell | 350 | 8.1% | |
| Turnout | 43.3% | |||
| Liberal Democrats gain from Conservative | ||||
Burstead
| Party | Candidate | Votes | % | |
|---|---|---|---|---|
| Liberal Democrats | G. Taylor | 2,190 | 54.8% | |
| Conservative | J. Kay | 1,357 | 34.0% | |
| Labour | P. Charles | 447 | 11.2% | |
| Turnout | 47.0% | |||
| Liberal Democrats gain from Conservative | ||||
Fryerns Central

| Party | Candidate | Votes | % | |
|---|---|---|---|---|
| Labour | P. Kirkman | 2,669 | 69.3% | |
| Conservative | P. Turner | 692 | 18.0% | |
| Liberal Democrats | K. Tyson | 489 | 12.7% | |
| Turnout | 47.6% | |||
| Labour hold | ||||
Fryerns East

| Party | Candidate | Votes | % | |
|---|---|---|---|---|
| Labour | J. Potter | 2,378 | 66.8% | |
| Conservative | S. Evens | 636 | 17.9% | |
| Liberal Democrats | J. Lutton | 544 | 15.3% | |
| Turnout | 45.2% | |||
| Labour hold | ||||
Laindon
| Party | Candidate | Votes | % | |
|---|---|---|---|---|
| Labour | M. Baker | 2,089 | 53.7% | |
| Conservative | S. Reid | 1,239 | 31.9% | |
| Liberal Democrats | C. Sweeney | 559 | 14.4% | |
| Turnout | 43.7% | |||
| Labour hold | ||||
Langdon Hills

| Party | Candidate | Votes | % | |
|---|---|---|---|---|
| Labour | L. Webb | 2,234 | 50.5% | |
| Conservative | S. Horgan | 1,547 | 35.0% | |
| Liberal Democrats | S. Evans | 645 | 14.6% | |
| Turnout | 49.4% | |||
| Labour hold | ||||
Lee Chapel North

| Party | Candidate | Votes | % | |
|---|---|---|---|---|
| Labour | R. Austin | 2,469 | 67.8% | |
| Conservative | A. Almond | 732 | 20.1% | |
| Liberal Democrats | T. Low | 438 | 12.0% | |
| Turnout | 48.3% | |||
| Labour hold | ||||
Nethermayne
| Party | Candidate | Votes | % | |
|---|---|---|---|---|
| Liberal Democrats | G. Williams | 1,768 | 45.0% | |
| Labour | C. Wilson | 1,278 | 32.5% | |
| Conservative | S. Elliott | 885 | 22.5% | |
| Turnout | 56.0% | |||
| Liberal Democrats hold | ||||
Pitsea East
| Party | Candidate | Votes | % | |
|---|---|---|---|---|
| Labour | D. Markes | 2,356 | 57.2% | |
| Conservative | A. Diamond | 1,268 | 30.8% | |
| Liberal Democrats | L. Williams | 497 | 12.1% | |
| Turnout | 38.6% | |||
| Labour hold | ||||
Pitsea West

| Party | Candidate | Votes | % | |
|---|---|---|---|---|
| Labour | J. Carty | 2,254 | 70.1% | |
| Conservative | H. Marshall | 602 | 18.7% | |
| Liberal Democrats | B. Williams | 360 | 11.2% | |
| Turnout | 38.7% | |||
| Labour hold | ||||
Vange
| Party | Candidate | Votes | % | |
|---|---|---|---|---|
| Labour | L. Rossati | 2,078 | 66.7% | |
| Conservative | A. Elliott | 645 | 20.7% | |
| Liberal Democrats | J. Campbell | 391 | 12.6% | |
| Turnout | 41.0% | |||
| Labour hold | ||||
Wickford North

| Party | Candidate | Votes | % | |
|---|---|---|---|---|
| Liberal Democrats | M. Birch | 2,012 | 46.6% | |
| Conservative | S. Buckley | 1,477 | 34.2% | |
| Labour | C. Wilson | 828 | 19.2% | |
| Turnout | 46.5% | |||
| Liberal Democrats gain from Conservative | ||||
Wickford South
| Party | Candidate | Votes | % | |
|---|---|---|---|---|
| Liberal Democrats | J. Pattison | 1,718 | 40.7% | |
| Conservative | D. Morris | 1,646 | 39.0% | |
| Labour | F. Curl | 712 | 16.9% | |
| Independent | R. Burge | 144 | 3.4% | |
| Turnout | 44.5% | |||
| Liberal Democrats gain from Conservative | ||||
References
| London boroughs |
|
|---|---|
| Metropolitan boroughs |
|
| District councils (England) |
|
| Regional councils (Scotland) | |
| Referendum | |
| |