Steele County, North Dakota
Steele County | |
|---|---|
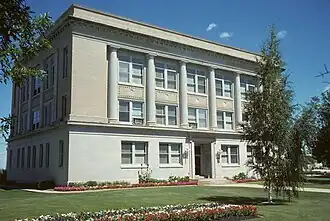 The Steele County Courthouse in Finley | |
 Location within the U.S. state of North Dakota | |
 North Dakota's location within the U.S. | |
| Coordinates: 47°27′04″N 97°43′08″W / 47.451062°N 97.71892°W | |
| Country | |
| State | |
| Founded | June 2, 1883 (created) July 13, 1883 (organized) |
| Named after | Edward H. Steele |
| Seat | Finley |
| Largest city | Finley |
| Area | |
• Total | 715.400 sq mi (1,852.88 km2) |
| • Land | 712.143 sq mi (1,844.44 km2) |
| • Water | 3.257 sq mi (8.44 km2) 0.46% |
| Population (2020) | |
• Total | 1,798 |
• Estimate (2024) | 1,767 |
| • Density | 2.481/sq mi (0.958/km2) |
| Time zone | UTC−6 (Central) |
| • Summer (DST) | UTC−5 (CDT) |
| Area code | 701 |
| Congressional district | At-large |
| Website | steelecountynd.gov |
Steele County is a county in the U.S. state of North Dakota. As of the 2020 census, the population was 1,798,[1] and was estimated to be 1,767 in 2024,[2] making it the fifth-least populous county in North Dakota. The county seat and the largest city is Finley.[3]
History
The Dakota Territory legislature created the county on June 2, 1883, with territories partitioned from Griggs and Traill counties. It was not organized at that time but was attached to Traill for administrative and judicial purposes. It was named for businessman Edward H. Steele, who had pushed for its creation.
On July 13, 1883, the county organization was affected and Steele County was detached from Traill County; Sherbrooke, North Dakota was chosen as the county seat. In 1897 the town of Finley was founded, and by 1919 its growth had eclipsed Sherbrooke to the point that the county seat was transferred to Finley.[4][5] The county's boundaries have been unchanged since its creation.

Geography
The Sheyenne River flows south near and into the county's west boundary line. The Goose River flows southeast through the northeastern part of the county. The terrain consists of rolling hills dotted with lakes and ponds. The area is devoted to agriculture.[6] The terrain slopes to the south and east; its highest point is near its northwestern corner, at 1,562 ft (476 m) ASL.[7]
According to the United States Census Bureau, the county has a total area of 715.400 square miles (1,852.88 km2), of which 712.143 square miles (1,844.44 km2) is land and 3.257 square miles (8.44 km2) (0.46%) is water.[8] It is the 50th largest county in North Dakota by total area.[9]
Major highways
Adjacent counties
- Grand Forks County - north
- Traill County - east
- Cass County - southeast
- Barnes County - southwest
- Griggs County - west
- Nelson County - northwest
Lakes[6]
- Golden Lake
- Golden Rush Lake
- Lake Tobiason
- Lone Tree Lake
- North Golden Lake
- Stony Lake
- Willow Lake
Demographics
| Census | Pop. | Note | %± |
|---|---|---|---|
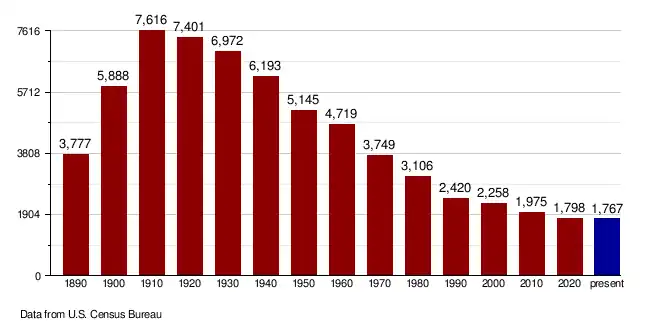
| 1890 | 3,777 | — | |
| 1900 | 5,888 | 55.9% | |
| 1910 | 7,616 | 29.3% | |
| 1920 | 7,401 | −2.8% | |
| 1930 | 6,972 | −5.8% | |
| 1940 | 6,193 | −11.2% | |
| 1950 | 5,145 | −16.9% | |
| 1960 | 4,719 | −8.3% | |
| 1970 | 3,749 | −20.6% | |
| 1980 | 3,106 | −17.2% | |
| 1990 | 2,420 | −22.1% | |
| 2000 | 2,258 | −6.7% | |
| 2010 | 1,975 | −12.5% | |
| 2020 | 1,798 | −9.0% | |
| 2024 (est.) | 1,767 | [10] | −1.7% |
| U.S. Decennial Census[11] 1790–1960[12] 1900–1990[13] 1990–2000[14] 2010–2020[2] | |||
As of the fourth quarter of 2024, the median home value in Steele County was $127,570.[15]
As of the 2023 American Community Survey, there are 731 estimated households in Steele County with an average of 2.37 persons per household. The county has a median household income of $80,313. Approximately 13.3% of the county's population lives at or below the poverty line. Steele County has an estimated 59.7% employment rate, with 29.6% of the population holding a bachelor's degree or higher and 94.5% holding a high school diploma.[2]
The top five reported ancestries (people were allowed to report up to two ancestries, thus the figures will generally add to more than 100%) were English (98.6%), Spanish (0.0%), Indo-European (1.4%), Asian and Pacific Islander (0.0%), and Other (0.1%).
The median age in the county was 46.4 years.
Steele County, North Dakota – racial and ethnic composition
Note: the US Census treats Hispanic/Latino as an ethnic category. This table excludes Latinos from the racial categories and assigns them to a separate category. Hispanics/Latinos may be of any race.
| Race / ethnicity (NH = non-Hispanic) | Pop. 1980[16] | Pop. 1990[17] | Pop. 2000[18] | Pop. 2010[19] | Pop. 2020[20] |
|---|---|---|---|---|---|
| White alone (NH) | 3,094 (99.61%) |
2,411 (99.63%) |
2,220 (98.32%) |
1,916 (97.01%) |
1,721 (95.72%) |
| Black or African American alone (NH) | 2 (0.06%) |
0 (0.00%) |
1 (0.04%) |
3 (0.15%) |
3 (0.17%) |
| Native American or Alaska Native alone (NH) | 1 (0.03%) |
2 (0.08%) |
14 (0.62%) |
23 (1.16%) |
7 (0.39%) |
| Asian alone (NH) | 6 (0.19%) |
2 (0.08%) |
1 (0.04%) |
2 (0.10%) |
0 (0.00%) |
| Pacific Islander alone (NH) | — | — | 0 (0.00%) |
0 (0.00%) |
0 (0.00%) |
| Other race alone (NH) | 0 (0.00%) |
0 (0.00%) |
1 (0.04%) |
1 (0.05%) |
0 (0.00%) |
| Mixed race or multiracial (NH) | — | — | 17 (0.75%) |
10 (0.51%) |
31 (1.72%) |
| Hispanic or Latino (any race) | 3 (0.10%) |
5 (0.21%) |
4 (0.18%) |
20 (1.01%) |
36 (2.00%) |
| Total | 3,106 (100.00%) |
2,420 (100.00%) |
2,258 (100.00%) |
1,975 (100.00%) |
1,798 (100.00%) |
2020 census
As of the 2020 census, there were 1,798 people, 788 households, and 515 families residing in the county.[21] The population density was 2.52 inhabitants per square mile (1.0/km2). There were 1,091 housing units at an average density of 1.53 per square mile (0.6/km2). The racial makeup of the county was 96.33% White, 0.17% African American, 0.39% Native American, 0.00% Asian, 0.22% Pacific Islander, 0.28% from some other races and 2.61% from two or more races. Hispanic or Latino people of any race were 2.00% of the population.[22]
2010 census
As of the 2010 census, there were 1,975 people, 864 households, and 589 families residing in the county. The population density was 2.8 inhabitants per square mile (1.1/km2). There were 1,171 housing units at an average density of 1.6 per square mile (0.6/km2). The racial makeup of the county was 97.57% White, 0.15% African American, 1.16% Native American, 0.10% Asian, 0.00% Pacific Islander, 0.41% from some other races and 0.61% from two or more races. Hispanic or Latino people of any race were 1.01% of the population.
In terms of ancestry, 60.0% were Norwegian, 35.2% were German, 5.4% were Irish, and 1.0% were American.
There were 864 households, 24.7% had children under the age of 18 living with them, 59.4% were married couples living together, 4.5% had a female householder with no husband present, 31.8% were non-families, and 27.8% of all households were made up of individuals. The average household size was 2.29 and the average family size was 2.78. The median age was 47.7 years.
The median income for a household in the county was $44,191 and the median income for a family was $54,625. Males had a median income of $36,588 versus $25,648 for females. The per capita income for the county was $27,728. About 4.3% of families and 4.2% of the population were below the poverty line, including 7.1% of those under age 18 and 5.1% of those age 65 or over.
Population by decade
Communities
Cities
Unincorporated communities[6]
- Blabon
- Colgate
- Pickert
- Sherbrooke[23] (original county seat; now mostly uninhabited)
Townships
- Beaver Creek
- Broadlawn
- Carpenter
- Colgate
- Easton
- Edendale
- Enger
- Finley
- Franklin
- Golden Lake
- Greenview
- Hugo
- Melrose
- Newburgh
- Primrose
- Riverside
- Sharon
- Sherbrooke
- Westfield
- Willow Lake
| Range 57 | Range 56 | Range 55 | Range 54 | |
|---|---|---|---|---|
| Township 148 | Sharon | Westfield | Beaver Creek | Newburgh |
| Township 147 | Franklin | Finley | Golden Lake | Enger |
| Township 146 | Greenview | Easton | Sherbrooke | Primrose |
| Township 145 | Riverside | Melrose | Hugo | Edendale |
| Township 144 | Willow Lake | Carpenter | Colgate | Broadlawn |
Politics
Steele County was a Democratic-leaning swing county in presidential elections until 2016, when Hillary Clinton lost to Donald Trump by nearly 20 points, an almost total flip from Barack Obama's 20 point win in 2008. In 2020, Joe Biden fared even worse despite a national increase for the Democratic Party from 2016. He was the first Democrat to win without the county since John F. Kennedy in 1960, and had the lowest proportion of the county's vote of any winning Democrat since Woodrow Wilson in 1912. Since 1964 Steele County has favored the Democratic presidential candidate in 64% of elections.
| Year | Republican | Democratic | Third party(ies) | |||
|---|---|---|---|---|---|---|
| No. | % | No. | % | No. | % | |
| 2024 | 622 | 61.28% | 367 | 36.16% | 26 | 2.56% |
| 2020 | 652 | 59.93% | 392 | 36.03% | 44 | 4.04% |
| 2016 | 538 | 53.85% | 361 | 36.14% | 100 | 10.01% |
| 2012 | 498 | 47.79% | 518 | 49.71% | 26 | 2.50% |
| 2008 | 404 | 39.15% | 614 | 59.50% | 14 | 1.36% |
| 2004 | 586 | 48.31% | 616 | 50.78% | 11 | 0.91% |
| 2000 | 655 | 54.13% | 475 | 39.26% | 80 | 6.61% |
| 1996 | 486 | 39.67% | 620 | 50.61% | 119 | 9.71% |
| 1992 | 503 | 36.72% | 598 | 43.65% | 269 | 19.64% |
| 1988 | 690 | 43.26% | 895 | 56.11% | 10 | 0.63% |
| 1984 | 941 | 54.08% | 781 | 44.89% | 18 | 1.03% |
| 1980 | 997 | 53.32% | 617 | 32.99% | 256 | 13.69% |
| 1976 | 835 | 43.35% | 1,066 | 55.35% | 25 | 1.30% |
| 1972 | 1,063 | 53.96% | 892 | 45.28% | 15 | 0.76% |
| 1968 | 952 | 46.87% | 991 | 48.79% | 88 | 4.33% |
| 1964 | 796 | 36.13% | 1,404 | 63.73% | 3 | 0.14% |
| 1960 | 1,209 | 50.76% | 1,173 | 49.24% | 0 | 0.00% |
| 1956 | 1,188 | 50.83% | 1,148 | 49.12% | 1 | 0.04% |
| 1952 | 1,513 | 62.16% | 911 | 37.43% | 10 | 0.41% |
| 1948 | 1,052 | 45.00% | 1,163 | 49.74% | 123 | 5.26% |
| 1944 | 1,042 | 43.89% | 1,320 | 55.60% | 12 | 0.51% |
| 1940 | 1,328 | 47.70% | 1,434 | 51.51% | 22 | 0.79% |
| 1936 | 724 | 25.20% | 1,444 | 50.26% | 705 | 24.54% |
| 1932 | 695 | 25.88% | 1,925 | 71.69% | 65 | 2.42% |
| 1928 | 1,574 | 57.34% | 1,152 | 41.97% | 19 | 0.69% |
| 1924 | 1,247 | 52.77% | 85 | 3.60% | 1,031 | 43.63% |
| 1920 | 2,222 | 85.17% | 337 | 12.92% | 50 | 1.92% |
| 1916 | 676 | 53.31% | 515 | 40.62% | 77 | 6.07% |
| 1912 | 237 | 23.58% | 253 | 25.17% | 515 | 51.24% |
| 1908 | 881 | 68.72% | 366 | 28.55% | 35 | 2.73% |
| 1904 | 817 | 86.82% | 69 | 7.33% | 55 | 5.84% |
| 1900 | 724 | 74.41% | 214 | 21.99% | 35 | 3.60% |
Education
School districts include:[26]
- [[
- Dakota Prairie Public School District 1
- Finley-Sharon Public School District 19
- Griggs County Central School District 18
- Hatton Public School District 7
- Hope-Page School District 85 (merger of Hope Public School District 10 and Page Public School District 80)
- May-Port CG Public School District 14
- Northwood Public School District 129
Former districts:
- Hope Public School District 10[26] - Consolidated with Page district in 2020[27]
- Page Public School District 80[26] - Consolidated with Hope district in 2020[27]
In 1964 the county had 992 students in four schools; at the time there were five school districts but Colgate was not operating any schools as its school closed in 1964.[28]
See also
References
- ^ "Explore Census Data". United States Census Bureau. Retrieved July 20, 2025.
- ^ a b c "U.S. Census Bureau QuickFacts: Steele County, North Dakota". www.census.gov. Retrieved July 20, 2025.
- ^ "Find a County". National Association of Counties. Retrieved July 20, 2025.
- ^ "Dakota Territory, South Dakota, and North Dakota: Individual County Chronologies". publications.newberry.org. The Newberry Library. 2006. Retrieved July 20, 2025.
- ^ "County History". www.nd.gov. State of North Dakota. Retrieved July 20, 2025.
- ^ a b c "Steele County, North Dakota". Google Maps. Retrieved April 27, 2024.
- ^ ""Find an Altitude/Steele County ND" Google Maps (accessed February 20, 2019)". Archived from the original on May 21, 2019. Retrieved February 20, 2019.
- ^ "2024 County Gazetteer Files – North Dakota". United States Census Bureau. Retrieved July 20, 2025.
- ^ "U.S. Census Bureau QuickFacts: Steele County, North Dakota". www.census.gov. Retrieved July 20, 2025.
- ^ "County Population Totals and Components of Change: 2020-2024". Retrieved July 1, 2025.
- ^ "U.S. Decennial Census". United States Census Bureau. Retrieved July 20, 2014.
- ^ "Historical Census Browser". University of Virginia Library. 2007. Archived from the original on December 12, 2009. Retrieved July 20, 2014.
- ^ Forstall, Richard L. (April 20, 1995). "Population of Counties by Decennial Census: 1900 to 1990". United States Census Bureau. Archived from the original on February 19, 1999. Retrieved July 20, 2014.
- ^ "Census 2000 PHC-T-4. Ranking Tables for Counties: 1990 and 2000" (PDF). United States Census Bureau. Archived (PDF) from the original on March 27, 2010. Retrieved July 20, 2014.
- ^ "County Median Home Price". National Association of Realtors. Retrieved July 1, 2025.
- ^ "Steele County, North Dakota — Population by Race". CensusScope. Retrieved July 16, 2025.
- ^ "1990 Census of Population: General Population Characteristics North Dakota" (PDF). www.census.gov. October 6, 2022. p. 20. Retrieved July 16, 2025.
- ^ "P004: Hispanic or Latino, and Not Hispanic or Latino by Race – 2000: DEC Summary File 1 – Steele County, North Dakota". United States Census Bureau. Retrieved July 16, 2025.
- ^ "P2: Hispanic or Latino, and Not Hispanic or Latino by Race – 2010: DEC Redistricting Data (PL 94-171) – Steele County, North Dakota". United States Census Bureau. Retrieved July 16, 2025.
- ^ "P2: Hispanic or Latino, and Not Hispanic or Latino by Race – 2020: DEC Redistricting Data (PL 94-171) – Steele County, North Dakota". United States Census Bureau. Retrieved July 16, 2025.
- ^ "US Census Bureau, Table P16: Household Type". United States Census Bureau. Retrieved July 20, 2025.
- ^ "How many people live in Steele County, North Dakota". USA Today. Retrieved July 20, 2025.
- ^ Ghosts of North Dakota: Sherbrooke
- ^ "Earth Point".
- ^ Leip, David. "Atlas of US Presidential Elections". uselectionatlas.org. Retrieved April 13, 2018.
- ^ a b c 2020 Census - School District Reference Map: Steele County, ND (PDF) (Map). United States Census Bureau. January 15, 2021. Retrieved July 20, 2025. - Text list
- ^ a b "Enrollment History Public School Districts 2009-2021". North Dakota Department of Public Instruction. Retrieved August 19, 2021. - Check the 2020-2021 spreadsheet, which lists a single "Hope Page" school district, and compare with all previous sheets which show them as two separate school districts.
- ^ "Per Pupil Costs Are Analyzed For County". Steele County Press. Finley, North Dakota. p. 10. - Clipping from Newspapers.com
External links
- Steele County – official website
- Steele County map, North Dakota DOT
Places adjacent to Steele County, North Dakota | ||||||||||||||||
|---|---|---|---|---|---|---|---|---|---|---|---|---|---|---|---|---|
| ||||||||||||||||
Municipalities and communities of , United States | ||
|---|---|---|
| Cities | | |
| Townships |
| |
| Unincorporated communities | ||
