2016 Washington Secretary of State election
| |||||||||||||||||
| |||||||||||||||||
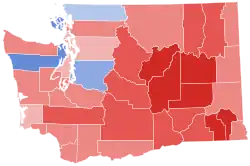
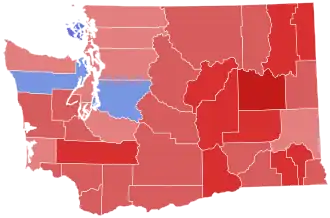   Wyman: 50–60% 60–70% 70–80% 80–90% >90% Podlodowski: 50–60% 60–70% 70–80% 80–90% >90% Tie: 50% No data | |||||||||||||||||
| |||||||||||||||||
.jpg)
.jpg)
| Elections in Washington (state) |
|---|
 |
The Washington Secretary of State election, 2016, was held on November 8, 2016. Incumbent Republican Kim Wyman won reelection over Democratic nominee Tina Podlodowski, the two having received the most votes in an August 2016 primary election.[1]
Kim Wyman was endorsed by the three preceding secretaries of state (Ralph Munro, Sam Reed, and Bruce Chapman), as well as the Seattle Times, King County Director of Elections Julie Wise, Pierce County Auditor Julie Anderson, the Washington Education Association, the Rental Housing Association of Washington, and the Sheet Metal, Air, Rail and Transportation Union.[2][3] As of September 2016, Wyman had raised about $395,000 for her campaign.[4]
Tina Podlodowski was endorsed by the incumbent, and two preceding, governors of Washington (Jay Inslee, Christine Gregoire, and Gary Locke), as well as Lakewood city councilor Mary Moss, the Washington State High School Democrats, and The Stranger.[5] As of September 2016, Podlodowski had raised about $460,000 for her campaign.[4]
- 40–50%
- 50–60%
- 60–70%
- 70–80%
- 40–50%
- 50–60%
- 60–70%
General election
Polling
Graphical summary
| Poll source | Date(s) administered |
Sample size |
Margin of error |
Kim Wyman (R) |
Tina Podlodowski (D) |
Undecided |
|---|---|---|---|---|---|---|
| Elway Poll[6] | October 20–22, 2016 | 502 (RV) | ± 4.5% | 41% | 37% | 22% |
| Normington Petts & Associates (D)[7][a] | September 27–29, 2016 | 600 (LV) | ± 4.0% | 31% | 35% | 34% |
| Elway Poll[8] | August 9–13, 2016 | 500 (RV) | ± 4.5% | 41% | 33% | 26% |
Results
| Party | Candidate | Votes | % | |
|---|---|---|---|---|
| Republican | Kim Wyman (incumbent) | 1,713,004 | 54.74% | |
| Democratic | Tina Podlodowski | 1,416,299 | 45.26% | |
| Total votes | 3,129,303 | 100.00% | ||
By county
| County[10] | Kim Wyman
Republican |
Tina Podlodowski
Democratic |
Margin | Total votes | |||
|---|---|---|---|---|---|---|---|
| # | % | # | % | # | % | ||
| Adams | 3,394 | 75.41% | 1,107 | 24.59% | 2,287 | 50.81% | 4,501 |
| Asotin | 6,477 | 68.85% | 2,930 | 31.15% | 3,547 | 37.71% | 9,407 |
| Benton | 57,340 | 72.71% | 21,524 | 27.29% | 35,816 | 45.41% | 78,864 |
| Chelan | 22,261 | 68.27% | 10,348 | 31.73% | 11,913 | 36.53% | 32,609 |
| Clallam | 22,800 | 59.35% | 15,613 | 40.65% | 7,187 | 18.71% | 38,413 |
| Clark | 118,264 | 60.77% | 76,361 | 39.23% | 41,903 | 21.53% | 194,625 |
| Columbia | 1,654 | 78.57% | 451 | 21.43% | 1,203 | 57.15% | 2,105 |
| Cowlitz | 28,206 | 63.24% | 16,397 | 36.76% | 11,809 | 26.48% | 44,603 |
| Douglas | 11,232 | 73.92% | 3,962 | 26.08% | 7,270 | 47.85% | 15,194 |
| Ferry | 2,395 | 69.20% | 1,066 | 30.80% | 1,329 | 38.40% | 3,461 |
| Franklin | 15,976 | 68.19% | 7,453 | 31.81% | 8,523 | 36.38% | 23,429 |
| Garfield | 942 | 78.89% | 252 | 21.11% | 690 | 57.79% | 1,194 |
| Grant | 20,837 | 75.42% | 6,792 | 24.58% | 14,045 | 50.83% | 27,629 |
| Grays Harbor | 16,881 | 60.21% | 11,156 | 39.79% | 5,725 | 20.42% | 28,037 |
| Island | 24,494 | 58.17% | 17,613 | 41.83% | 6,881 | 16.34% | 42,107 |
| Jefferson | 8,475 | 42.44% | 11,495 | 57.56% | -3,020 | -15.12% | 19,970 |
| King | 396,466 | 41.30% | 563,438 | 58.70% | -166,972 | -17.39% | 959,904 |
| Kitsap | 69,426 | 56.53% | 53,392 | 43.47% | 16,034 | 13.06% | 122,818 |
| Kittitas | 12,298 | 66.74% | 6,129 | 33.26% | 6,169 | 33.48% | 18,427 |
| Klickitat | 6,593 | 63.24% | 3,833 | 36.76% | 2,760 | 26.47% | 10,426 |
| Lewis | 25,134 | 74.30% | 8,694 | 25.70% | 16,440 | 48.60% | 33,828 |
| Lincoln | 4,492 | 80.62% | 1,080 | 19.38% | 3,412 | 61.23% | 5,572 |
| Mason | 17,295 | 62.39% | 10,426 | 37.61% | 6,869 | 24.78% | 27,721 |
| Okanogan | 10,788 | 65.14% | 5,772 | 34.86% | 5,016 | 30.29% | 16,560 |
| Pacific | 6,027 | 58.27% | 4,316 | 41.73% | 1,711 | 16.54% | 10,343 |
| Pend Oreille | 4,715 | 71.39% | 1,890 | 28.61% | 2,825 | 42.77% | 6,605 |
| Pierce | 200,835 | 58.76% | 140,962 | 41.24% | 59,873 | 17.52% | 341,797 |
| San Juan | 4,044 | 38.30% | 6,516 | 61.70% | -2,472 | -23.41% | 10,560 |
| Skagit | 32,714 | 59.30% | 22,457 | 40.70% | 10,257 | 18.59% | 55,171 |
| Skamania | 3,343 | 62.07% | 2,043 | 37.93% | 1,300 | 24.14% | 5,386 |
| Snohomish | 189,420 | 55.92% | 149,325 | 44.08% | 40,095 | 11.84% | 338,745 |
| Spokane | 141,818 | 63.91% | 80,092 | 36.09% | 61,726 | 27.82% | 221,910 |
| Stevens | 16,676 | 75.33% | 5,460 | 24.67% | 11,216 | 50.67% | 22,136 |
| Thurston | 77,292 | 60.37% | 50,743 | 39.63% | 26,549 | 20.74% | 128,035 |
| Wahkiakum | 1,429 | 64.69% | 780 | 35.31% | 649 | 29.38% | 2,209 |
| Walla Walla | 16,698 | 67.86% | 7,910 | 32.14% | 8,788 | 35.71% | 24,608 |
| Whatcom | 53,932 | 50.16% | 53,581 | 49.84% | 351 | 0.33% | 107,513 |
| Whitman | 9,969 | 59.05% | 6,913 | 40.95% | 3,056 | 18.10% | 16,882 |
| Yakima | 49,972 | 65.75% | 26,027 | 34.25% | 23,945 | 31.51% | 75,999 |
| Totals | 1,713,004 | 54.74% | 1,416,299 | 45.26% | 296,705 | 9.48% | 3,129,303 |
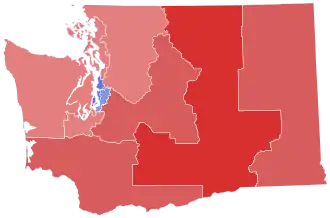
By congressional district
Wyman won eight of ten congressional districts, including four that elected Democrats.[9]
| District | Wyman | Podlodowski | Representative |
|---|---|---|---|
| 1st | 58% | 42% | Suzan DelBene |
| 2nd | 51% | 49% | Rick Larsen |
| 3rd | 63% | 37% | Jaime Herrera Beutler |
| 4th | 70% | 30% | Dan Newhouse |
| 5th | 65% | 35% | Cathy McMorris Rodgers |
| 6th | 55% | 45% | Derek Kilmer |
| 7th | 31% | 69% | Jim McDermott |
| 8th | 62% | 38% | Dave Reichert |
| 9th | 42% | 58% | Adam Smith |
| 10th | 59% | 41% | Denny Heck |
See also
Notes
- ^ Poll sponsored by Podlodowski's campaign
References
- ^ "Washington secretary of state could face tough re-election test". Seattle Times. May 22, 2016. Retrieved September 2, 2016.
- ^ "Kim Wyman". Ballotpedia. Retrieved September 2, 2016.
- ^ "ENDORSEMENTS". kimwyman.com. Kim Wyman. Archived from the original on September 14, 2016. Retrieved September 2, 2016.
- ^ a b "Statewide Candidates". pdc.wa.gov. Public Disclosure Commission. Archived from the original on November 18, 2016. Retrieved September 2, 2016.
- ^ "Endorsements". Voters for Tina. Retrieved September 2, 2016.
- ^ Elway Poll
- ^ Normington Petts & Associates (D)
- ^ Elway Poll
- ^ a b "2016 General Data". sos.wa.gov. Archived from the original on March 15, 2025.
- ^ Wyman, Kim (November 8, 2016). "Secretary of State - County Results". Secretary of State of Washington. Archived from the original on May 19, 2025. Retrieved August 7, 2025.