Union County, Illinois
Union County | |
|---|---|
 Union County Courthouse in Jonesboro | |
 Location within the U.S. state of Illinois | |
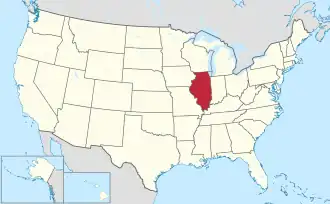 Illinois's location within the U.S. | |
| Coordinates: 37°28′N 89°16′W / 37.47°N 89.26°W | |
| Country | |
| State | |
| Founded | January 2, 1818 |
| Seat | Jonesboro |
| Largest city | Anna |
| Area | |
• Total | 422 sq mi (1,090 km2) |
| • Land | 413 sq mi (1,070 km2) |
| • Water | 8.7 sq mi (23 km2) 2.1% |
| Population (2020) | |
• Total | 17,244 |
• Estimate (2023) | 16,667 |
| • Density | 41/sq mi (16/km2) |
| Time zone | UTC−6 (Central) |
| • Summer (DST) | UTC−5 (CDT) |
| Congressional district | 12th |
| Website | www |
Union County is a county located in the U.S. state of Illinois. According to the 2020 United States census, it had a population of 17,244.[1] Its county seat is Jonesboro.[2] It is located in the southern portion of Illinois known locally as "Little Egypt".
History
Union County was formed out of Johnson County, nearly a year before the Illinois Territory gained statehood.[3] It was named for a joint revival meeting of the Baptists and Dunkards, called a "union meeting". The county seal depicts the leaders of these two groups shaking hands.[4]
-
![For its first year of existence, Union County included an area of unorganized territory temporarily attached to it.[5]](./_assets_/Union_County_Illinois_1818.png) For its first year of existence, Union County included an area of unorganized territory temporarily attached to it.[5]
For its first year of existence, Union County included an area of unorganized territory temporarily attached to it.[5] -
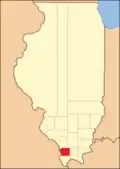 In 1819, the additional territory became Alexander County, reducing Union to its current borders.
Geography
According to the US Census Bureau, the county has a total area of 422 square miles (1,090 km2), of which 413 square miles (1,070 km2) is land and 8.7 square miles (23 km2) (2.1%) is water.[6]
Climate and weather
| Jonesboro, Illinois | ||||||||||||||||||||||||||||||||||||||||||||||||||||||||||||
|---|---|---|---|---|---|---|---|---|---|---|---|---|---|---|---|---|---|---|---|---|---|---|---|---|---|---|---|---|---|---|---|---|---|---|---|---|---|---|---|---|---|---|---|---|---|---|---|---|---|---|---|---|---|---|---|---|---|---|---|---|
| Climate chart (explanation) | ||||||||||||||||||||||||||||||||||||||||||||||||||||||||||||
| ||||||||||||||||||||||||||||||||||||||||||||||||||||||||||||
| ||||||||||||||||||||||||||||||||||||||||||||||||||||||||||||
In recent years, average temperatures in the county seat of Jonesboro have ranged from a low of 22 °F (−6 °C) in January to a high of 90 °F (32 °C) in July, although a record low of −20 °F (−29 °C) was recorded in January 1918 and a record high of 112 °F (44 °C) was recorded in July 1901. Average monthly precipitation ranged from 3.13 inches (80 mm) in September to 5.22 inches (133 mm) in May.[7]
Major highways
Adjacent counties
- Jackson County – north
- Williamson County – northeast
- Johnson County – east
- Pulaski County – southeast
- Alexander County – south
- Cape Girardeau County, Missouri – west
- Perry County, Missouri – northwest
Protected areas
- Brown Barrens Nature Preserve[8]
- Crab Orchard National Wildlife Refuge (partial)
- Cypress Creek National Wildlife Refuge (partial)
- Lincoln Memorial Picnic Grounds[9]
- Giant City State Park (partial)
- McClure Shale Glade Nature Preserve[10]
- Trail of Tears State Forest
- Shawnee National Forest (partial)
- Union County State Fish and Wildlife Area
Demographics
| Census | Pop. | Note | %± |
|---|---|---|---|
| 1820 | 2,362 | — | |
| 1830 | 3,239 | 37.1% | |
| 1840 | 5,524 | 70.5% | |
| 1850 | 7,615 | 37.9% | |
| 1860 | 11,181 | 46.8% | |
| 1870 | 16,518 | 47.7% | |
| 1880 | 18,102 | 9.6% | |
| 1890 | 21,549 | 19.0% | |
| 1900 | 22,610 | 4.9% | |
| 1910 | 21,856 | −3.3% | |
| 1920 | 20,249 | −7.4% | |
| 1930 | 19,883 | −1.8% | |
| 1940 | 21,528 | 8.3% | |
| 1950 | 20,500 | −4.8% | |
| 1960 | 17,645 | −13.9% | |
| 1970 | 16,071 | −8.9% | |
| 1980 | 17,765 | 10.5% | |
| 1990 | 17,619 | −0.8% | |
| 2000 | 18,293 | 3.8% | |
| 2010 | 17,808 | −2.7% | |
| 2020 | 17,244 | −3.2% | |
| 2023 (est.) | 16,667 | [11] | −3.3% |
| US Decennial Census[12] 1790-1960[13] 1900-1990[14] 1990-2000[15] 2010-2013[1] 2020[16] | |||
2020 census
| Race / Ethnicity (NH = Non-Hispanic) | Pop 1980[17] | Pop 1990[18] | Pop 2000[19] | Pop 2010[20] | Pop 2020[21] | % 1980 | % 1990 | % 2000 | % 2010 | % 2020 |
|---|---|---|---|---|---|---|---|---|---|---|
| White alone (NH) | 17,563 | 17,243 | 17,407 | 16,454 | 15,331 | 98.86% | 97.87% | 95.16% | 92.40% | 88.91% |
| Black or African American alone (NH) | 68 | 122 | 149 | 151 | 226 | 0.38% | 0.69% | 0.81% | 0.85% | 1.31% |
| Native American or Alaska Native alone (NH) | 19 | 22 | 62 | 59 | 46 | 0.11% | 0.12% | 0.34% | 0.33% | 0.27% |
| Asian alone (NH) | 16 | 50 | 48 | 52 | 67 | 0.09% | 0.28% | 0.26% | 0.29% | 0.39% |
| Native Hawaiian or Pacific Islander alone (NH) | x [22] | x [23] | 2 | 5 | 11 | x | x | 0.01% | 0.03% | 0.06% |
| Other race alone (NH) | 8 | 0 | 6 | 8 | 28 | 0.05% | 0.00% | 0.03% | 0.04% | 0.16% |
| Mixed race or Multiracial (NH) | x [24] | x [25] | 138 | 216 | 668 | x | x | 0.75% | 1.21% | 3.87% |
| Hispanic or Latino (any race) | 91 | 182 | 481 | 863 | 867 | 0.51% | 1.03% | 2.63% | 4.85% | 5.03% |
| Total | 17,765 | 17,619 | 18,293 | 17,808 | 17,244 | 100.00% | 100.00% | 100.00% | 100.00% | 100.00% |
2010 census
As of the 2010 United States Census, there were 17,808 people, 7,167 households, and 4,837 families residing in the county.[26] The population density was 43.1 inhabitants per square mile (16.6/km2). There were 7,924 housing units at an average density of 19.2 per square mile (7.4/km2).[6] The racial makeup of the county was 94.8% white, 0.9% black or African American, 0.5% American Indian, 0.3% Asian, 2.0% from other races, and 1.5% from two or more races. Those of Hispanic or Latino origin made up 4.8% of the population.[26] In terms of ancestry, 23.0% were German, 12.6% were Irish, 9.4% were English, and 8.1% were American.[27]
Of the 7,167 households, 29.7% had children under the age of 18 living with them, 52.6% were married couples living together, 10.6% had a female householder with no husband present, 32.5% were non-families, and 28.4% of all households were made up of individuals. The average household size was 2.41 and the average family size was 2.92. The median age was 42.9 years.[26]
The median income for a household in the county was $39,760 and the median income for a family was $48,465. Males had a median income of $36,831 versus $31,272 for females. The per capita income for the county was $19,512. About 12.7% of families and 21.1% of the population were below the poverty line, including 22.5% of those under age 18 and 16.7% of those age 65 or over.[28]
Communities
Cities
Villages
Unincorporated communities
Politics
Like much of Southern Illinois, Union County has shifted toward the Republican Party over the past couple decades,[29] with the Republican candidate for president winning the county since 2000.
| Year | Republican | Democratic | Third party(ies) | |||
|---|---|---|---|---|---|---|
| No. | % | No. | % | No. | % | |
| 2024 | 5,837 | 70.60% | 2,285 | 27.64% | 146 | 1.77% |
| 2020 | 6,161 | 69.19% | 2,579 | 28.96% | 164 | 1.84% |
| 2016 | 5,790 | 67.20% | 2,402 | 27.88% | 424 | 4.92% |
| 2012 | 4,957 | 59.59% | 3,137 | 37.71% | 224 | 2.69% |
| 2008 | 5,003 | 54.65% | 3,918 | 42.80% | 233 | 2.55% |
| 2004 | 5,333 | 58.48% | 3,735 | 40.96% | 51 | 0.56% |
| 2000 | 4,397 | 50.77% | 3,982 | 45.98% | 281 | 3.24% |
| 1996 | 3,147 | 38.00% | 4,252 | 51.34% | 883 | 10.66% |
| 1992 | 3,003 | 33.06% | 4,681 | 51.54% | 1,399 | 15.40% |
| 1988 | 4,244 | 50.05% | 4,197 | 49.50% | 38 | 0.45% |
| 1984 | 4,721 | 55.13% | 3,815 | 44.55% | 28 | 0.33% |
| 1980 | 4,289 | 50.81% | 3,781 | 44.79% | 371 | 4.40% |
| 1976 | 3,531 | 41.16% | 5,003 | 58.32% | 44 | 0.51% |
| 1972 | 5,034 | 59.36% | 3,428 | 40.42% | 18 | 0.21% |
| 1968 | 3,889 | 46.45% | 3,603 | 43.04% | 880 | 10.51% |
| 1964 | 3,142 | 37.63% | 5,208 | 62.37% | 0 | 0.00% |
| 1960 | 4,432 | 50.58% | 4,321 | 49.31% | 10 | 0.11% |
| 1956 | 4,204 | 49.06% | 4,359 | 50.87% | 6 | 0.07% |
| 1952 | 4,658 | 51.97% | 4,296 | 47.93% | 9 | 0.10% |
| 1948 | 3,864 | 46.01% | 4,479 | 53.33% | 55 | 0.65% |
| 1944 | 4,114 | 48.25% | 4,367 | 51.21% | 46 | 0.54% |
| 1940 | 4,915 | 45.51% | 5,804 | 53.74% | 81 | 0.75% |
| 1936 | 4,165 | 39.81% | 6,260 | 59.84% | 36 | 0.34% |
| 1932 | 2,859 | 31.47% | 6,157 | 67.77% | 69 | 0.76% |
| 1928 | 3,352 | 44.52% | 4,149 | 55.10% | 29 | 0.39% |
| 1924 | 2,579 | 39.16% | 3,783 | 57.44% | 224 | 3.40% |
| 1920 | 3,119 | 45.55% | 3,660 | 53.45% | 68 | 0.99% |
| 1916 | 3,135 | 37.11% | 5,171 | 61.22% | 141 | 1.67% |
| 1912 | 458 | 10.44% | 2,648 | 60.36% | 1,281 | 29.20% |
| 1908 | 1,695 | 37.43% | 2,690 | 59.40% | 144 | 3.18% |
| 1904 | 1,537 | 39.54% | 1,967 | 50.60% | 383 | 9.85% |
| 1900 | 1,695 | 36.49% | 2,900 | 62.43% | 50 | 1.08% |
| 1896 | 1,842 | 37.65% | 2,998 | 61.28% | 52 | 1.06% |
| 1892 | 1,427 | 33.96% | 2,663 | 63.37% | 112 | 2.67% |
Education
School districts include:[31]
K-12:
- Cobden School Unit District 17
- Dongola School Unit District 66
- Goreville Community Unit School District 1
- Shawnee Community Unit School District 84
Secondary:
- Anna Jonesboro Community High School District 81
- Vienna High School District 133
Elementary:
- Anna Community Consolidated School District 37
- Buncombe Consolidated School District 43
- Cypress School District 64
- Jonesboro Community Consolidated School District 43
- Lick Creek Community Consolidated School District 16
See also
- National Register of Historic Places listings in Union County, Illinois
- Ku Klux Klan in Southern Illinois
References
- ^ a b "State & County QuickFacts". US Census Bureau.
- ^ "Find a County". National Association of Counties. Archived from the original on May 3, 2015. Retrieved June 7, 2011.
- ^ Perrin 1883, p. 285.
- ^ Callary, Edward (2009). Place Names of Illinois. Urbana and Chicago, Illinois: University of Illinois Press. p. 354.
- ^ White, Jesse (March 2010). "Origin and Evolution of Illinois Counties" (PDF). State of Illinois. Archived (PDF) from the original on October 12, 2012. Retrieved September 26, 2012.
- ^ a b "Population, Housing Units, Area, and Density: 2010 - County". US Census Bureau. Archived from the original on February 13, 2020. Retrieved July 12, 2015.
- ^ a b "Monthly Averages for Jonesboro IL". The Weather Channel. Archived from the original on October 23, 2012. Retrieved January 27, 2011.
- ^ Brown Barrens Nature Preserve, Union County IL Google Maps (accessed 29 December 2018)
- ^ Lincoln Memorial Picnic Grounds, Union County IL Google Maps (accessed 29 December 2018)
- ^ McClure Shale Glade Nature Preserve, Union County IL Google Maps (accessed 29 December 2018)
- ^ "Annual Estimates of the Resident Population for Counties: April 1, 2020 to July 1, 2023". United States Census Bureau. Retrieved April 2, 2024.
- ^ "US Decennial Census". US Census Bureau. Retrieved July 9, 2014.
- ^ "Historical Census Browser". University of Virginia Library. Archived from the original on August 11, 2012. Retrieved July 9, 2014.
- ^ "Population of Counties by Decennial Census: 1900 to 1990". US Census Bureau. Archived from the original on April 24, 2014. Retrieved July 9, 2014.
- ^ "Census 2000 PHC-T-4. Ranking Tables for Counties: 1990 and 2000" (PDF). US Census Bureau. Archived (PDF) from the original on December 18, 2014. Retrieved July 9, 2014.
- ^ "Explore Census Data".
- ^ "1980 Census of Population - General Population Characteristics - Illinois- Table 14 - Persons by Race and Table 16 (p. 18-28) - Total Persons and Spanish Origin Persons by Type of Spanish Origin and Race (p. 29-39)" (PDF). United States Census Bureau.
- ^ "1990 Census of Population - General Population Characteristics - Illinois - Table 6 - Race and Hispanic Orogin" (PDF). United States Census Bureau.
- ^ "P004: Hispanic or Latino, and Not Hispanic or Latino by Race – 2000: DEC Summary File 1 – Union County, Illinois". United States Census Bureau.
- ^ "P2: Hispanic or Latino, and Not Hispanic or Latino by Race – 2010: DEC Redistricting Data (PL 94-171) – Union County, Illinois". United States Census Bureau.
- ^ "P2: Hispanic or Latino, and Not Hispanic or Latino by Race – 2020: DEC Redistricting Data (PL 94-171) – Union County, Illinois". United States Census Bureau.
- ^ included in the Asian category in the 1980 Census
- ^ included in the Asian category in the 1990 Census
- ^ not an option in the 1980 Census
- ^ not an option in the 1990 Census
- ^ a b c "Profile of General Population and Housing Characteristics: 2010 Demographic Profile Data". US Census Bureau. Archived from the original on February 13, 2020. Retrieved July 12, 2015.
- ^ "Selected Social Characteristics in the United States – 2006-2010 American Community Survey 5-Year Estimates". US Census Bureau. Archived from the original on February 13, 2020. Retrieved July 12, 2015.
- ^ "Selected Economic Characteristics – 2006-2010 American Community Survey 5-Year Estimates". US Census Bureau. Archived from the original on February 13, 2020. Retrieved July 12, 2015.
- ^ Service, CHUCK RAASCH Herald & Review News. "Political scale tips toward GOP in southern Illinois, northeast Missouri". Herald-Review.com. Retrieved January 19, 2021.
- ^ Leip, David. "Atlas of US Presidential Elections". uselectionatlas.org. Archived from the original on March 23, 2018. Retrieved May 1, 2018.
- ^ "2020 CENSUS - SCHOOL DISTRICT REFERENCE MAP: Union County, IL" (PDF). U.S. Census Bureau. Retrieved July 22, 2022. - Text list
Bibliography
- Perrin, William Henry, ed. (1883). History of Alexander, Union and Pulaski Counties, Illinois. Chicago IL: O.L. Baskin & Co. OCLC 8695008. OL 13507970M.
- U.S. Geological Survey Geographic Names Information System: Union County, Illinois
External links
- Union County Official Website
- Union County State's Attorney
- Union County Treasurer
- Union County Chamber of Commerce
Places adjacent to Union County, Illinois | |
|---|---|
Municipalities and communities of , United States | ||
|---|---|---|
| Cities | | |
| Villages | ||
| Precincts |
| |
| Unincorporated communities | ||
| Counties | 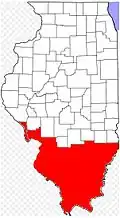 | |
|---|---|---|
| Mid-sized cities (25,000+) | ||
| Small cities (10,000-25,000) | ||
| Small cities (5,000-10,000) | ||
| Transit systems | ||
| Amtrak stations | ||
| Interstates | ||
| Airports/military bases |
| |
| Universities | ||
| Colleges | ||
| Sports teams based in Southern Illinois | ||