Stark County, Illinois
Stark County | |
|---|---|
 | |
 Location within the U.S. state of Illinois | |
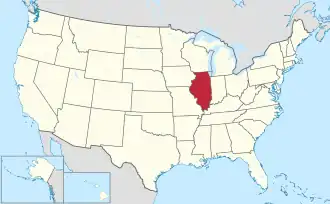 Illinois's location within the U.S. | |
| Coordinates: 41°05′N 89°47′W / 41.09°N 89.79°W | |
| Country | |
| State | |
| Founded | 1839 |
| Named after | John Stark |
| Seat | Toulon |
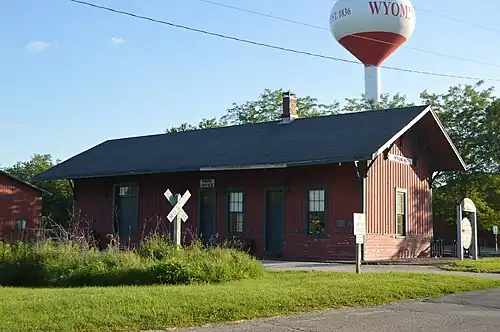
| Largest city | Wyoming |
| Area | |
• Total | 288 sq mi (750 km2) |
| • Land | 288 sq mi (750 km2) |
| • Water | 0.3 sq mi (0.8 km2) 0.1% |
| Population (2020) | |
• Total | 5,400 |
• Estimate (2023) | 5,218 |
| • Density | 19/sq mi (7.2/km2) |
| Time zone | UTC−6 (Central) |
| • Summer (DST) | UTC−5 (CDT) |
| Congressional district | 16th |
| Website | www |
Stark County is a county in Illinois, United States. According to the 2020 census, it had a population of 5,400.[1] Its county seat is Toulon.[2] Stark County is part of the Peoria, Illinois, metropolitan area.
History
Stark County was formed in 1839 out of Knox and Putnam counties. It was named for General Colonel John Stark, who served in the American Continental Army during the American Revolutionary War. He became known as the "Hero of Bennington" for his exemplary service at the Battle of Bennington in 1777.
-
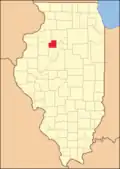 Stark County at the time of its creation in 1839
Geography
According to the U.S. Census Bureau, the county has a total area of 288 square miles (750 km2), of which 288 square miles (750 km2) is land and 0.3 square miles (0.78 km2) (0.1%) is water.[3]
Climate and weather
| Toulon, Illinois | ||||||||||||||||||||||||||||||||||||||||||||||||||||||||||||
|---|---|---|---|---|---|---|---|---|---|---|---|---|---|---|---|---|---|---|---|---|---|---|---|---|---|---|---|---|---|---|---|---|---|---|---|---|---|---|---|---|---|---|---|---|---|---|---|---|---|---|---|---|---|---|---|---|---|---|---|---|
| Climate chart (explanation) | ||||||||||||||||||||||||||||||||||||||||||||||||||||||||||||
| ||||||||||||||||||||||||||||||||||||||||||||||||||||||||||||
| ||||||||||||||||||||||||||||||||||||||||||||||||||||||||||||
In recent years, average temperatures in the county seat of Toulon have ranged from a low of 10 °F (−12 °C) in January to a high of 84 °F (29 °C) in July, although a record low of −26 °F (−32 °C) was recorded in January 1999 and a record high of 104 °F (40 °C) was recorded in July 1983. Average monthly precipitation ranged from 1.41 inches (36 mm) in February to 4.46 inches (113 mm) in June.[4]
Major highways
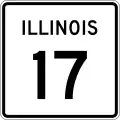 Illinois Route 17
 Illinois Route 18
 Illinois Route 40
 Illinois Route 78
 Illinois Route 91
 Illinois Route 93
Adjacent counties
- Henry County (northwest)
- Bureau County (north)
- Marshall County (east)
- Peoria County (south)
- Knox County (west)
Demographics
| Census | Pop. | Note | %± |
|---|---|---|---|
| 1840 | 1,573 | — | |
| 1850 | 3,710 | 135.9% | |
| 1860 | 9,004 | 142.7% | |
| 1870 | 10,751 | 19.4% | |
| 1880 | 11,207 | 4.2% | |
| 1890 | 9,982 | −10.9% | |
| 1900 | 10,186 | 2.0% | |
| 1910 | 10,098 | −0.9% | |
| 1920 | 9,693 | −4.0% | |
| 1930 | 9,184 | −5.3% | |
| 1940 | 8,881 | −3.3% | |
| 1950 | 8,721 | −1.8% | |
| 1960 | 8,152 | −6.5% | |
| 1970 | 7,510 | −7.9% | |
| 1980 | 7,389 | −1.6% | |
| 1990 | 6,534 | −11.6% | |
| 2000 | 6,332 | −3.1% | |
| 2010 | 5,994 | −5.3% | |
| 2020 | 5,400 | −9.9% | |
| 2023 (est.) | 5,218 | [5] | −3.4% |
| U.S. Decennial Census[6] 1790-1960[7] 1900-1990[8] 1990-2000[9] 2010[10] | |||
2020 census
| Race / Ethnicity (NH = Non-Hispanic) | Pop 1980 | Pop 1990 | Pop 2000[11] | Pop 2010[12] | Pop 2020[13] | % 1980 | % 1990 | % 2000 | % 2010 | % 2020 |
|---|---|---|---|---|---|---|---|---|---|---|
| White alone (NH) | 7,328 | 6,470 | 6,213 | 5,826 | 5,070 | 99.17% | 99.02% | 98.12% | 97.20% | 93.89% |
| Black or African American alone (NH) | 4 | 5 | 4 | 28 | 17 | 0.05% | 0.08% | 0.06% | 0.47% | 0.31% |
| Native American or Alaska Native alone (NH) | 11 | 8 | 10 | 9 | 8 | 0.15% | 0.12% | 0.16% | 0.15% | 0.15% |
| Asian alone (NH) | 10 | 21 | 12 | 19 | 23 | 0.14% | 0.32% | 0.19% | 0.32% | 0.43% |
| Native Hawaiian or Pacific Islander alone (NH) | x [14] | x [15] | 0 | 0 | 0 | x | x | 0.00% | 0.00% | 0.00% |
| Other race alone (NH) | 1 | 0 | 0 | 1 | 5 | 0.01% | 0.00% | 0.00% | 0.02% | 0.09% |
| Mixed race or Multiracial (NH) | x [16] | x [17] | 39 | 52 | 145 | x | x | 0.62% | 0.87% | 2.69% |
| Hispanic or Latino (any race) | 35 | 30 | 54 | 59 | 132 | 0.47% | 0.46% | 0.85% | 0.98% | 2.44% |
| Total | 7,389 | 6,534 | 6,332 | 5,994 | 5,400 | 100.00% | 100.00% | 100.00% | 100.00% | 100.00% |
2010 census
As of the 2010 census, there were 5,994 people, 2,425 households, and 1,673 families residing in the county.[18] The population density was 20.8 inhabitants per square mile (8.0/km2). There were 2,674 housing units at an average density of 9.3 per square mile (3.6/km2).[3] The racial makeup of the county was 97.7% white, 0.5% black or African American, 0.3% Asian, 0.2% American Indian, 0.3% from other races, and 1.0% from two or more races. Those of Hispanic or Latino origin made up 1.0% of the population.[18] In terms of ancestry, 33.5% were German, 15.5% were Irish, 13.8% were English, 10.8% were American, and 9.8% were Swedish.[19]
Of the 2,425 households, 28.9% had children under the age of 18 living with them, 56.6% were married couples living together, 8.0% had a female householder with no husband present, 31.0% were non-families, and 26.8% of all households were made up of individuals. The average household size was 2.43 and the average family size was 2.93. The median age was 43.8 years.[18]
The median income for a household in the county was $49,195 and the median income for a family was $62,681. Males had a median income of $44,931 versus $29,621 for females. The per capita income for the county was $25,311. About 7.6% of families and 11.2% of the population were below the poverty line, including 17.0% of those under age 18 and 4.8% of those age 65 or over.[20]
Communities
Cities
Villages
Unincorporated communities
Townships
Stark County is divided into these townships:
Politics
| Year | Republican | Democratic | Third party(ies) | |||
|---|---|---|---|---|---|---|
| No. | % | No. | % | No. | % | |
| 2024 | 1,983 | 71.72% | 725 | 26.22% | 57 | 2.06% |
| 2020 | 2,004 | 69.44% | 815 | 28.24% | 67 | 2.32% |
| 2016 | 1,778 | 64.82% | 751 | 27.38% | 214 | 7.80% |
| 2012 | 1,528 | 57.40% | 1,095 | 41.13% | 39 | 1.47% |
| 2008 | 1,513 | 51.83% | 1,357 | 46.49% | 49 | 1.68% |
| 2004 | 1,841 | 60.14% | 1,189 | 38.84% | 31 | 1.01% |
| 2000 | 1,694 | 56.67% | 1,211 | 40.52% | 84 | 2.81% |
| 1996 | 1,278 | 44.62% | 1,262 | 44.06% | 324 | 11.31% |
| 1992 | 1,384 | 41.30% | 1,336 | 39.87% | 631 | 18.83% |
| 1988 | 1,841 | 58.39% | 1,274 | 40.41% | 38 | 1.21% |
| 1984 | 2,228 | 67.15% | 1,072 | 32.31% | 18 | 0.54% |
| 1980 | 2,358 | 69.76% | 806 | 23.85% | 216 | 6.39% |
| 1976 | 2,191 | 63.34% | 1,146 | 33.13% | 122 | 3.53% |
| 1972 | 2,529 | 71.44% | 993 | 28.05% | 18 | 0.51% |
| 1968 | 2,292 | 62.54% | 1,128 | 30.78% | 245 | 6.68% |
| 1964 | 2,117 | 54.38% | 1,776 | 45.62% | 0 | 0.00% |
| 1960 | 2,925 | 67.80% | 1,383 | 32.06% | 6 | 0.14% |
| 1956 | 3,241 | 74.32% | 1,118 | 25.64% | 2 | 0.05% |
| 1952 | 3,398 | 75.51% | 1,100 | 24.44% | 2 | 0.04% |
| 1948 | 2,537 | 68.44% | 1,163 | 31.37% | 7 | 0.19% |
| 1944 | 3,050 | 68.42% | 1,401 | 31.43% | 7 | 0.16% |
| 1940 | 3,393 | 64.94% | 1,818 | 34.79% | 14 | 0.27% |
| 1936 | 2,696 | 54.38% | 2,220 | 44.78% | 42 | 0.85% |
| 1932 | 2,119 | 46.75% | 2,369 | 52.26% | 45 | 0.99% |
| 1928 | 2,966 | 69.09% | 1,306 | 30.42% | 21 | 0.49% |
| 1924 | 2,698 | 71.07% | 784 | 20.65% | 314 | 8.27% |
| 1920 | 2,750 | 79.57% | 661 | 19.13% | 45 | 1.30% |
| 1916 | 2,887 | 66.57% | 1,390 | 32.05% | 60 | 1.38% |
| 1912 | 549 | 23.46% | 669 | 28.59% | 1,122 | 47.95% |
| 1908 | 1,635 | 66.27% | 738 | 29.91% | 94 | 3.81% |
| 1904 | 1,764 | 71.27% | 574 | 23.19% | 137 | 5.54% |
| 1900 | 1,665 | 61.37% | 939 | 34.61% | 109 | 4.02% |
| 1896 | 1,636 | 60.04% | 1,030 | 37.80% | 59 | 2.17% |
| 1892 | 1,240 | 50.76% | 824 | 33.73% | 379 | 15.51% |
Since the American Civil War, Stark County has been heavily Republican, like most of Yankee-influenced Northern Illinois. The only Democratic presidential nominee to carry Stark County in the past 150 years has been Franklin D. Roosevelt in 1932, although Bob Dole won by just sixteen votes against Bill Clinton in 1996, and Progressive Theodore Roosevelt won the county in 1912 when the Republican Party was mortally divided between Roosevelt and conservative incumbent William Howard Taft.
See also
References
![]() This article incorporates text from Stark County and Its Pioneers, by Shallenberger, Eliza Hall, a publication from 1876, now in the public domain in the United States.
This article incorporates text from Stark County and Its Pioneers, by Shallenberger, Eliza Hall, a publication from 1876, now in the public domain in the United States.
- ^ "Stark County, Illinois". United States Census Bureau. Retrieved June 10, 2023.
- ^ "Find a County". National Association of Counties. Retrieved June 7, 2011.
- ^ a b "Population, Housing Units, Area, and Density: 2010 - County". United States Census Bureau. Archived from the original on February 12, 2020. Retrieved July 12, 2015.
- ^ a b "Monthly Averages for Toulon, Illinois". The Weather Channel. Retrieved January 27, 2011.
- ^ "Annual Estimates of the Resident Population for Counties: April 1, 2020 to July 1, 2023". United States Census Bureau. Retrieved April 2, 2024.
- ^ "U.S. Decennial Census". United States Census Bureau. Retrieved July 8, 2014.
- ^ "Historical Census Browser". University of Virginia Library. Retrieved July 8, 2014.
- ^ "Population of Counties by Decennial Census: 1900 to 1990". United States Census Bureau. Retrieved July 8, 2014.
- ^ "Census 2000 PHC-T-4. Ranking Tables for Counties: 1990 and 2000" (PDF). United States Census Bureau. Retrieved July 8, 2014.
- ^ "State & County QuickFacts". United States Census Bureau. Archived from the original on August 23, 2011. Retrieved July 8, 2014.
- ^ "P004: Hispanic or Latino, and Not Hispanic or Latino by Race – 2000: DEC Summary File 1 – Stark County, Illinois". United States Census Bureau.
- ^ "P2: Hispanic or Latino, and Not Hispanic or Latino by Race – 2010: DEC Redistricting Data (PL 94-171) – Stark County, Illinois". United States Census Bureau.
- ^ "P2: Hispanic or Latino, and Not Hispanic or Latino by Race – 2020: DEC Redistricting Data (PL 94-171) – Stark County, Illinois". United States Census Bureau.
- ^ included in the Asian category in the 1980 Census
- ^ included in the Asian category in the 1990 Census
- ^ not an option in the 1980 Census
- ^ not an option in the 1990 Census
- ^ a b c "DP-1 Profile of General Population and Housing Characteristics: 2010 Demographic Profile Data". United States Census Bureau. Archived from the original on February 13, 2020. Retrieved July 12, 2015.
- ^ "DP02 SELECTED SOCIAL CHARACTERISTICS IN THE UNITED STATES – 2006-2010 American Community Survey 5-Year Estimates". United States Census Bureau. Archived from the original on February 13, 2020. Retrieved July 12, 2015.
- ^ "DP03 SELECTED ECONOMIC CHARACTERISTICS – 2006-2010 American Community Survey 5-Year Estimates". United States Census Bureau. Archived from the original on February 13, 2020. Retrieved July 12, 2015.
- ^ Leip, David. "Dave Leip's Atlas of U.S. Presidential Elections". uselectionatlas.org. Retrieved November 12, 2018.
External links
- Stark County Website
- The Stark County News
- Wyoming IL Chamber of Commerce
- Wyoming IL Lions Club
- Tanners Orchard
Places adjacent to Stark County, Illinois | ||||||||||||||||
|---|---|---|---|---|---|---|---|---|---|---|---|---|---|---|---|---|
| ||||||||||||||||
Municipalities and communities of , United States | ||
|---|---|---|
| Cities | | |
| Villages | ||
| Townships | ||
| Unincorporated communities | ||