1987 Derby City Council election
| |||||||||||||||||||||||||||||||||||||
15 of the 44 seats in the Derby City Council 23 seats needed for a majority | |||||||||||||||||||||||||||||||||||||
|---|---|---|---|---|---|---|---|---|---|---|---|---|---|---|---|---|---|---|---|---|---|---|---|---|---|---|---|---|---|---|---|---|---|---|---|---|---|
| |||||||||||||||||||||||||||||||||||||
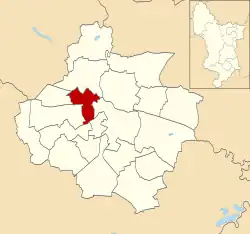
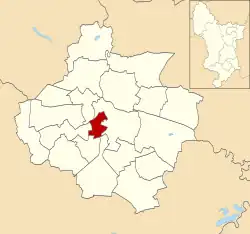
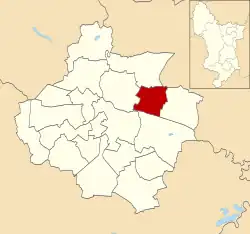
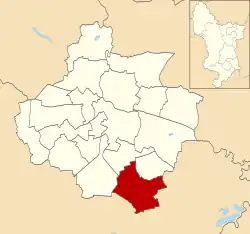
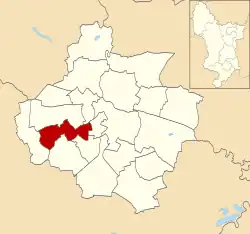
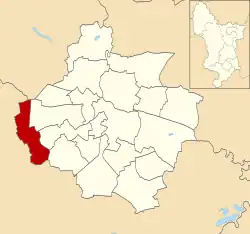
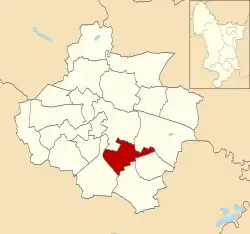
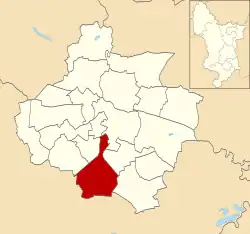
 Map showing the results of the 1987 Derby City Council elections. | |||||||||||||||||||||||||||||||||||||
| |||||||||||||||||||||||||||||||||||||
The 1987 Derby City Council election took place on 7 May 1987 to elect members of Derby City Council in England. Local elections were held in the United Kingdom in 1987.[3] This was on the same day as other local elections. 15 of the council's 44 seats were up for election. The Labour Party retained control of the council.
Overall results
| Party | Seats | Gains | Losses | Net gain/loss | Seats % | Votes % | Votes | +/− | |
|---|---|---|---|---|---|---|---|---|---|
| Conservative | 8 | 2 | 0 | 53.3 | 44.6 | 24,797 | |||
| Labour | 7 | 1 | 2 | 46.7 | 35.3 | 19,617 | |||
| Alliance | 0 | 0 | 1 | 0.0 | 19.2 | 10,687 | |||
| Independent | 0 | 0 | 0 | 0.0 | 0.9 | 501 | |||
| Total | 15 | 55,602 | |||||||
Ward results
Abbey
| Party | Candidate | Votes | % | |
|---|---|---|---|---|
| Labour | M. Ainsley | 1,669 | 45.4% | |
| Conservative | B. Larimore | 1,432 | 38.9% | |
| Alliance | L. Wilson | 579 | 15.7% | |
| Turnout | % | |||
| Labour hold | ||||
Babington
| Party | Candidate | Votes | % | |
|---|---|---|---|---|
| Labour | J. Maltby | 1,593 | 52.7% | |
| SDP-Liberal Alliance | M. Burgess | 815 | 27.0% | |
| Conservative | T. Fogg | 613 | 20.3% | |
| Turnout | 36.5% | |||
| Labour hold | ||||
Chaddesden
| Party | Candidate | Votes | % | |
|---|---|---|---|---|
| Conservative | H. Johnson | 1,923 | 46.2% | |
| Labour Party (UK) | M. Streets | 1,502 | 36.1% | |
| Alliance | H. Holbrook | 733 | 17.6% | |
| Turnout | 47.3% | |||
| Conservative gain from Labour | ||||
Chellaston
| Party | Candidate | Votes | % | |
|---|---|---|---|---|
| Conservative | J. Jennings | 2,611 | 51.7% | |
| Labour | W. Lythgoe | 1,457 | 28.8% | |
| Alliance | M. Essex | 615 | 12.2% | |
| Independent | J. Lissett | 369 | 7.3% | |
| Turnout | 54.1% | |||
| Conservative hold | ||||
Darley
| Party | Candidate | Votes | % | |
|---|---|---|---|---|
| Conservative | P. Hickson | 2,797 | 55.7% | |
| Labour | M. Repton | 1,377 | 27.4% | |
| SDP-Liberal Alliance | L. Pratt | 849 | 16.9% | |
| Turnout | 53.3% | |||
| Conservative hold | ||||
Derwent
| Party | Candidate | Votes | % | |
|---|---|---|---|---|
| Labour | F. Tunnicliffe | 1,348 | 42.4% | |
| Alliance | S. King | 1,221 | 38.4% | |
| Conservative | D. Heath | 611 | 19.2% | |
| Turnout | 42.5% | |||
| Labour gain from Alliance | ||||
Kingsway
| Party | Candidate | Votes | % | |
|---|---|---|---|---|
| Conservative | M. Bertalan | 2,191 | 58.6% | |
| Alliance | L. Barker | 860 | 23.0% | |
| Labour | J. Evans | 662 | 17.7% | |
| Independent | S. Gibson | 26 | 0.7% | |
| Turnout | 47.3% | |||
| Conservative hold | ||||
Litchurch
| Party | Candidate | Votes | % | |
|---|---|---|---|---|
| Labour | J. McGiven | 1,585 | 57.1% | |
| Conservative | B. Wayne | 688 | 24.8% | |
| Alliance | R. Khan | 504 | 18.1% | |
| Turnout | 34.8% | |||
| Labour hold | ||||
Littleover
| Party | Candidate | Votes | % | |
|---|---|---|---|---|
| Conservative | R. Wood | 1,976 | 51.1% | |
| Labour | A. Cooper | 938 | 24.3% | |
| Alliance | R. Turner | 847 | 21.9% | |
| Independent | K. Dickenson | 106 | 2.7% | |
| Turnout | 53.1% | |||
| Conservative hold | ||||
Mackworth

| Party | Candidate | Votes | % | |
|---|---|---|---|---|
| Conservative | A. Clemson | 1,378 | 42.4% | |
| Labour | M. Tanvir | 1,251 | 38.5% | |
| Alliance | R. Jackson | 619 | 19.1% | |
| Turnout | 44.6% | |||
| Conservative gain from Labour | ||||
Mickleover
| Party | Candidate | Votes | % | |
|---|---|---|---|---|
| Conservative | N. Glen | 2,842 | 65.2% | |
| Alliance | A. Wilbraham | 899 | 20.6% | |
| Labour | P. Taylor | 617 | 14.2% | |
| Turnout | 51.2% | |||
| Conservative hold | ||||
Normanton

| Party | Candidate | Votes | % | |
|---|---|---|---|---|
| Labour | F. Brocklehurst | 1,473 | 47.6% | |
| Conservative | D. Hogg | 1,137 | 36.7% | |
| Alliance | W. Drew | 486 | 15.7% | |
| Turnout | 39.6% | |||
| Labour hold | ||||
Osmaston
| Party | Candidate | Votes | % | |
|---|---|---|---|---|
| Labour | J. Woolley | 1,119 | 57.0% | |
| Conservative | D. Brown | 511 | 26.0% | |
| Alliance | P. Elsbury | 334 | 17.0% | |
| Turnout | 30.1% | |||
| Labour hold | ||||
Sinfin
| Party | Candidate | Votes | % | |
|---|---|---|---|---|
| Labour | A. Mullarkey | 1,500 | 52.0% | |
| Conservative | K. Lester | 869 | 30.1% | |
| Alliance | P. James | 514 | 17.8% | |
| Turnout | 38.3% | |||
| Labour hold | ||||
Spondon
| Party | Candidate | Votes | % | |
|---|---|---|---|---|
| Conservative | C. Brown | 3,218 | 57.9% | |
| Labour | D. Hayes | 1,617 | 29.1% | |
| Alliance | R. Guilford | 721 | 13.0% | |
| Turnout | 53.8% | |||
| Conservative hold | ||||
References
- ^ "Council compositions by year". The Elections Centre.
- ^ "Local Election Summaries 1987". The Elections Centre.
- ^ Rallings, Colin; Thrasher, Michael. Local Elections Handbook 1987 volume 1. The Elections Centre. Retrieved 15 February 2020.
- ^ a b c d e f g h i j k l m n o "Derby City Council Election Results 1979-1995" (PDF). Elections Centre.
| Metropolitan boroughs |
|
|---|---|
| District councils (England) |
|
| District councils (Wales) |
|
| |