1982 Derby City Council election
| |||||||||||||||||||||||||||||||
15 of the 44 seats in the Derby City Council 23 seats needed for a majority | |||||||||||||||||||||||||||||||
|---|---|---|---|---|---|---|---|---|---|---|---|---|---|---|---|---|---|---|---|---|---|---|---|---|---|---|---|---|---|---|---|
| |||||||||||||||||||||||||||||||
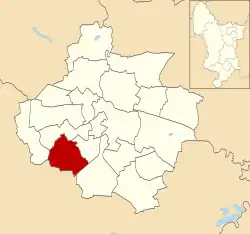
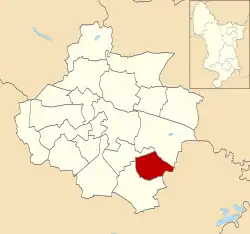
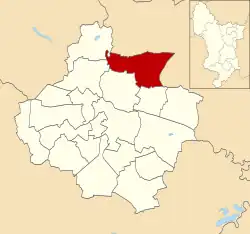
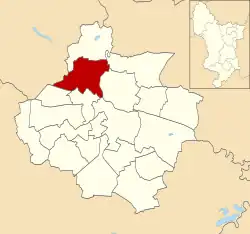
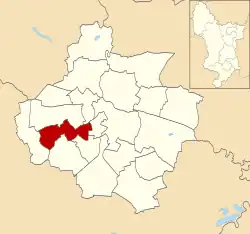
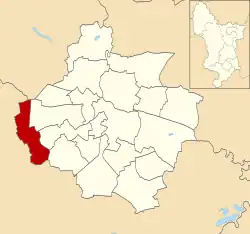
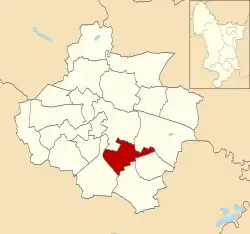
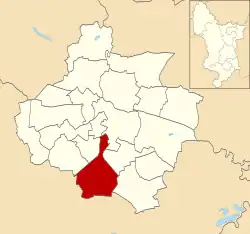
 Map showing the results of the 1982 Derby City Council elections. | |||||||||||||||||||||||||||||||
| |||||||||||||||||||||||||||||||
The 1982 Derby City Council election took place on 6 May 1982 to elect members of Derby City Council in England.[3] This was on the same day as other local elections. 15 of the council's 44 seats were up for election. The Labour Party retained control of the council.
Overall results
| Party | Seats | Gains | Losses | Net gain/loss | Seats % | Votes % | Votes | +/− | |
|---|---|---|---|---|---|---|---|---|---|
| Labour | 9 | 0 | 0 | 60.0 | 34.8 | 17,229 | |||
| Conservative | 6 | 0 | 0 | 40.0 | 38.9 | 19,254 | |||
| Alliance | 0 | 0 | 0 | 0.0 | 25.4 | 12,585 | |||
| Independent | 0 | 0 | 0 | 0.0 | 0.7 | 368 | |||
| United English National | 0 | 0 | 0 | 0.0 | 0.1 | 50 | |||
| Total | 15 | 49,486 | |||||||
Ward results
Abbey
| Party | Candidate | Votes | % | |
|---|---|---|---|---|
| Labour | M. Walker | 1,461 | 47.0% | |
| Conservative | M. Rowley | 921 | 29.6% | |
| Alliance | D. Cocker | 726 | 23.4% | |
| Turnout | 33.3% | |||
| Labour hold | ||||
Allestree
| Party | Candidate | Votes | % | |
|---|---|---|---|---|
| Conservative | J. Thorpe | 2,687 | 63.4% | |
| Alliance | W. Webley | 1,177 | 27.8% | |
| Labour | K. Clarke | 374 | 8.8% | |
| Turnout | 51.7% | |||
| Conservative hold | ||||
Alvaston
| Party | Candidate | Votes | % | |
|---|---|---|---|---|
| Labour | J. Osborn | 933 | 37.5% | |
| Conservative | J. Lissett | 784 | 31.5% | |
| Alliance | I. Graham | 771 | 31.0% | |
| Turnout | 35.2% | |||
| Labour hold | ||||
Babington
| Party | Candidate | Votes | % | |
|---|---|---|---|---|
| Labour | W. Matthews | 1,710 | 56.4% | |
| Conservative | R. Brown | 516 | 17.0% | |
| Alliance | R. Cliff | 436 | 14.4% | |
| Independent | K. Johal | 368 | 12.1% | |
| Turnout | 32.8% | |||
| Labour hold | ||||
Blagreaves
| Party | Candidate | Votes | % | |
|---|---|---|---|---|
| Conservative | J. Keith | 1,756 | 44.1% | |
| Labour | R. Turner | 1,172 | 29.5% | |
| Alliance | D. George | 1,051 | 26.4% | |
| Turnout | 49.5% | |||
| Conservative hold | ||||
Boulton
| Party | Candidate | Votes | % | |
|---|---|---|---|---|
| Labour | A. Kennedy | 1,413 | 39.0% | |
| Conservative | H. Sephton | 1,141 | 31.5% | |
| Alliance | C. Moore | 1,073 | 29.6% | |
| Turnout | 40.1% | |||
| Labour hold | ||||
Breadsall
| Party | Candidate | Votes | % | |
|---|---|---|---|---|
| Labour | E. Ward | 1,526 | 41.4% | |
| Alliance | F. Bell | 1,062 | 28.8% | |
| Conservative | B. Oxley | 1,051 | 28.5% | |
| United English National | S. Gibson | 50 | 1.4% | |
| Turnout | 37.0% | |||
| Labour hold | ||||
Darley
| Party | Candidate | Votes | % | |
|---|---|---|---|---|
| Conservative | J. Tillett | 2,366 | 58.5% | |
| Alliance | E. Woods | 994 | 24.6% | |
| Labour | R. Eddy | 687 | 17.0% | |
| Turnout | 42.6% | |||
| Conservative hold | ||||
Littleover
| Party | Candidate | Votes | % | |
|---|---|---|---|---|
| Conservative | L. Shepley | 1,756 | 56.5% | |
| Alliance | G. Taylor | 787 | 25.3% | |
| Labour | M. Taylor | 564 | 18.2% | |
| Turnout | 44.8% | |||
| Conservative hold | ||||
Mackworth

| Party | Candidate | Votes | % | |
|---|---|---|---|---|
| Labour | R. Baxter | 1,465 | 51.3% | |
| Conservative | J. Gabrielczyk | 698 | 24.4% | |
| Alliance | P. King | 695 | 24.3% | |
| Turnout | 37.3% | |||
| Labour hold | ||||
Mickleover
| Party | Candidate | Votes | % | |
|---|---|---|---|---|
| Conservative | N. Keene | 1,901 | 52.0% | |
| Alliance | B. Stokes | 1,211 | 33.1% | |
| Labour | D. Dorrell | 543 | 14.9% | |
| Turnout | 46.4% | |||
| Conservative hold | ||||
Normanton

| Party | Candidate | Votes | % | |
|---|---|---|---|---|
| Labour | L. Shillingford | 1,475 | 51.2% | |
| Conservative | J. Matthews | 870 | 30.2% | |
| Alliance | J. Bottomley | 536 | 18.6% | |
| Turnout | 36.4% | |||
| Labour hold | ||||
Osmaston
| Party | Candidate | Votes | % | |
|---|---|---|---|---|
| Labour | R. Laxton | 1,096 | 61.9% | |
| Conservative | R. Debrick | 357 | 20.1% | |
| Alliance | E. Taylor | 319 | 18.0% | |
| Turnout | 25.0% | |||
| Labour hold | ||||
Sinfin
| Party | Candidate | Votes | % | |
|---|---|---|---|---|
| Labour | N. Dhindsa | 1,438 | 51.6% | |
| Conservative | G. Andrews | 676 | 24.2% | |
| Alliance | J. Glazebrook | 674 | 24.2% | |
| Turnout | 37.1% | |||
| Labour hold | ||||
Spondon
| Party | Candidate | Votes | % | |
|---|---|---|---|---|
| Conservative | G. Du Sautoy | 1,774 | 42.0% | |
| Labour | R. Thrower | 1,372 | 32.5% | |
| Alliance | K. Tivey | 1,073 | 25.4% | |
| Turnout | 42.1% | |||
| Conservative hold | ||||
References
- ^ "Council compositions by year". The Elections Centre.
- ^ "Local Election Summaries 1982". The Elections Centre.
- ^ Rallings, Colin; Thrasher, Michael. Local Elections Handbook 1982. Plymouth University, Plymouth, UK: The Elections Centre. p. 16.
- ^ a b c d e f g h i j k l m n o "Derby City Council Election Results 1979-1995" (PDF). Elections Centre.
| London boroughs |
|
|---|---|
| Metropolitan boroughs |
|
| District councils (England) |
|
| Regional councils (Scotland) | |