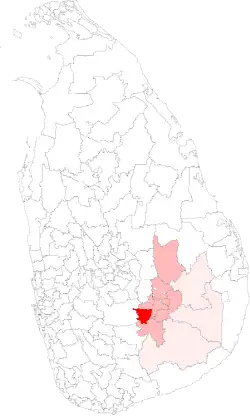
The Welimada Polling Division is a Polling Division in the Badulla Electoral District, in the Uva Province, Sri Lanka.
Presidential Election Results
Summary
The winner of Welimada has matched the final country result 6 out of 8 times. Hence, Welimada is a Weak Bellwether for Presidential Elections.
| Party
|
Welimada[4]
|
Badulla Electoral District
|
Sri Lanka
|
| Votes
|
%
|
Votes
|
%
|
Votes
|
%
|
|
|
SLPP
|
|
30,670
|
48.15%
|
|
276,211
|
49.29%
|
|
6,924,255
|
52.25%
|
|
|
NDF
|
|
29,673
|
46.58%
|
|
251,706
|
44.92%
|
|
5,564,239
|
41.99%
|
|
|
Other Parties (with < 1%)
|
|
1,687
|
2.65%
|
|
17,622
|
3.14%
|
|
345,452
|
2.61%
|
|
|
NMPP
|
|
1,671
|
2.62%
|
|
14,806
|
2.64%
|
|
418,553
|
3.16%
|
| Valid Votes
|
63,701
|
99.02%
|
560,345
|
98.77%
|
13,252,499
|
98.99%
|
| Rejected Votes
|
632
|
0.98%
|
6,978
|
1.23%
|
135,452
|
1.01%
|
| Total Polled
|
64,333
|
86.02%
|
567,323
|
86.25%
|
13,387,951
|
83.71%
|
| Registered Electors
|
74,786
|
|
657,766
|
|
15,992,568
|
|
| Party
|
Welimada[5]
|
Badulla Electoral District
|
Sri Lanka
|
| Votes
|
%
|
Votes
|
%
|
Votes
|
%
|
|
|
NDF
|
|
29,431
|
50.68%
|
|
249,524
|
49.21%
|
|
6,217,162
|
51.28%
|
|
|
UPFA
|
|
27,874
|
48.00%
|
|
249,243
|
49.15%
|
|
5,768,090
|
47.58%
|
|
|
Other Parties (with < 1%)
|
|
770
|
1.33%
|
|
8,303
|
1.64%
|
|
138,200
|
1.14%
|
| Valid Votes
|
58,075
|
98.87%
|
507,070
|
98.47%
|
12,123,452
|
98.85%
|
| Rejected Votes
|
664
|
1.13%
|
7,871
|
1.53%
|
140,925
|
1.15%
|
| Total Polled
|
58,739
|
78.91%
|
514,941
|
79.51%
|
12,264,377
|
78.69%
|
| Registered Electors
|
74,436
|
|
647,628
|
|
15,585,942
|
|
| Party
|
Welimada[6]
|
Badulla Electoral District
|
Sri Lanka
|
| Votes
|
%
|
Votes
|
%
|
Votes
|
%
|
|
|
UPFA
|
|
27,252
|
53.19%
|
|
237,579
|
53.23%
|
|
6,015,934
|
57.88%
|
|
|
NDF
|
|
23,092
|
45.07%
|
|
198,835
|
44.55%
|
|
4,173,185
|
40.15%
|
|
|
Other Parties (with < 1%)
|
|
888
|
1.73%
|
|
9,880
|
2.21%
|
|
204,494
|
1.97%
|
| Valid Votes
|
51,232
|
99.02%
|
446,294
|
98.66%
|
10,393,613
|
99.03%
|
| Rejected Votes
|
509
|
0.98%
|
6,083
|
1.34%
|
101,838
|
0.97%
|
| Total Polled
|
51,741
|
75.06%
|
452,377
|
75.62%
|
10,495,451
|
66.70%
|
| Registered Electors
|
68,937
|
|
598,190
|
|
15,734,587
|
|
| Party
|
Welimada[7]
|
Badulla Electoral District
|
Sri Lanka
|
| Votes
|
%
|
Votes
|
%
|
Votes
|
%
|
|
|
UNP
|
|
26,108
|
51.55%
|
|
226,582
|
53.11%
|
|
4,706,366
|
48.43%
|
|
|
UPFA
|
|
23,736
|
46.87%
|
|
192,734
|
45.18%
|
|
4,887,152
|
50.29%
|
|
|
Other Parties (with < 1%)
|
|
801
|
1.58%
|
|
7,283
|
1.71%
|
|
123,521
|
1.27%
|
| Valid Votes
|
50,645
|
98.75%
|
426,599
|
98.43%
|
9,717,039
|
98.88%
|
| Rejected Votes
|
640
|
1.25%
|
6,825
|
1.57%
|
109,869
|
1.12%
|
| Total Polled
|
51,285
|
79.54%
|
433,424
|
78.67%
|
9,826,908
|
69.51%
|
| Registered Electors
|
64,481
|
|
550,926
|
|
14,136,979
|
|
| Party
|
Welimada[8]
|
Badulla Electoral District
|
Sri Lanka
|
| Votes
|
%
|
Votes
|
%
|
Votes
|
%
|
|
|
UNP
|
|
20,447
|
47.38%
|
|
172,884
|
47.97%
|
|
3,602,748
|
42.71%
|
|
|
PA
|
|
20,063
|
46.49%
|
|
167,000
|
46.33%
|
|
4,312,157
|
51.12%
|
|
|
JVP
|
|
1,665
|
3.86%
|
|
12,025
|
3.34%
|
|
343,927
|
4.08%
|
|
|
Other Parties (with < 1%)
|
|
981
|
2.27%
|
|
8,512
|
2.36%
|
|
176,679
|
2.09%
|
| Valid Votes
|
43,156
|
97.29%
|
360,421
|
97.04%
|
8,435,754
|
97.69%
|
| Rejected Votes
|
1,203
|
2.71%
|
10,979
|
2.96%
|
199,536
|
2.31%
|
| Total Polled
|
44,359
|
78.97%
|
371,400
|
78.25%
|
8,635,290
|
72.17%
|
| Registered Electors
|
56,170
|
|
474,610
|
|
11,965,536
|
|
| Party
|
Welimada[9]
|
Badulla Electoral District
|
Sri Lanka
|
| Votes
|
%
|
Votes
|
%
|
Votes
|
%
|
|
|
PA
|
|
22,177
|
55.23%
|
|
182,810
|
55.27%
|
|
4,709,205
|
62.28%
|
|
|
UNP
|
|
17,280
|
43.04%
|
|
139,611
|
42.21%
|
|
2,715,283
|
35.91%
|
|
|
Other Parties (with < 1%)
|
|
695
|
1.73%
|
|
8,351
|
2.52%
|
|
137,040
|
1.81%
|
| Valid Votes
|
40,152
|
96.44%
|
330,772
|
95.91%
|
7,561,526
|
98.03%
|
| Rejected Votes
|
1,482
|
3.56%
|
14,093
|
4.09%
|
151,706
|
1.97%
|
| Total Polled
|
41,634
|
77.61%
|
344,865
|
77.47%
|
7,713,232
|
69.12%
|
| Registered Electors
|
53,643
|
|
445,146
|
|
11,158,880
|
|
| Party
|
Welimada[10]
|
Badulla Electoral District
|
Sri Lanka
|
| Votes
|
%
|
Votes
|
%
|
Votes
|
%
|
|
|
UNP
|
|
7,491
|
66.27%
|
|
80,779
|
60.09%
|
|
2,569,199
|
50.43%
|
|
|
SLFP
|
|
3,580
|
31.67%
|
|
50,223
|
37.36%
|
|
2,289,857
|
44.95%
|
|
|
SLMP
|
|
232
|
2.05%
|
|
3,422
|
2.55%
|
|
235,701
|
4.63%
|
| Valid Votes
|
11,303
|
97.99%
|
134,424
|
97.62%
|
5,094,754
|
98.24%
|
| Rejected Votes
|
232
|
2.01%
|
3,276
|
2.38%
|
91,499
|
1.76%
|
| Total Polled
|
11,535
|
27.57%
|
137,700
|
44.21%
|
5,186,256
|
55.87%
|
| Registered Electors
|
41,846
|
|
311,473
|
|
9,283,143
|
|
| Party
|
Welimada[11]
|
Badulla Electoral District
|
Sri Lanka
|
| Votes
|
%
|
Votes
|
%
|
Votes
|
%
|
|
|
UNP
|
|
18,673
|
60.64%
|
|
141,062
|
58.67%
|
|
3,450,815
|
52.93%
|
|
|
SLFP
|
|
10,078
|
32.73%
|
|
88,462
|
36.79%
|
|
2,546,348
|
39.05%
|
|
|
JVP
|
|
1,745
|
5.67%
|
|
7,713
|
3.21%
|
|
273,428
|
4.19%
|
|
|
Other Parties (with < 1%)
|
|
295
|
0.96%
|
|
3,203
|
1.33%
|
|
249,460
|
3.83%
|
| Valid Votes
|
30,791
|
98.60%
|
240,440
|
98.77%
|
6,520,156
|
98.78%
|
| Rejected Votes
|
437
|
1.40%
|
2,982
|
1.23%
|
80,470
|
1.22%
|
| Total Polled
|
31,228
|
86.44%
|
243,422
|
85.47%
|
6,600,626
|
80.15%
|
| Registered Electors
|
36,128
|
|
284,801
|
|
8,235,358
|
|
Parliamentary Election Results
Summary
The winner of Welimada has matched the final country result 5 out of 7 times. Hence, Welimada is a Weak Bellwether for Parliamentary Elections.
| Party
|
Welimada[14]
|
Badulla Electoral District
|
Sri Lanka
|
| Votes
|
%
|
Votes
|
%
|
Votes
|
%
|
|
|
UNP
|
|
30,086
|
56.07%
|
|
258,844
|
54.82%
|
|
5,098,916
|
45.77%
|
|
|
UPFA
|
|
20,127
|
37.51%
|
|
179,459
|
38.01%
|
|
4,732,664
|
42.48%
|
|
|
JVP
|
|
2,497
|
4.65%
|
|
21,445
|
4.54%
|
|
544,154
|
4.88%
|
|
|
CWC
|
|
687
|
1.28%
|
|
10,259
|
2.17%
|
|
17,107
|
0.15%
|
|
|
Other Parties (with < 1%)
|
|
258
|
0.48%
|
|
2,159
|
0.46%
|
|
76,945
|
0.69%
|
| Valid Votes
|
53,655
|
95.68%
|
472,166
|
95.03%
|
11,140,333
|
95.35%
|
| Rejected Votes
|
2,384
|
4.25%
|
24,167
|
4.86%
|
516,926
|
4.42%
|
| Total Polled
|
56,076
|
75.33%
|
496,849
|
80.07%
|
11,684,111
|
77.66%
|
| Registered Electors
|
74,436
|
|
620,486
|
|
15,044,490
|
|
| Party
|
Welimada[15]
|
Badulla Electoral District
|
Sri Lanka
|
| Votes
|
%
|
Votes
|
%
|
Votes
|
%
|
|
|
UPFA
|
|
19,820
|
50.04%
|
|
203,689
|
58.25%
|
|
4,846,388
|
60.38%
|
|
|
UNP
|
|
14,070
|
35.52%
|
|
112,886
|
32.28%
|
|
2,357,057
|
29.37%
|
|
|
IG4B
|
|
3,221
|
8.13%
|
|
4,646
|
1.33%
|
|
5,076
|
0.06%
|
|
|
DNA
|
|
1,816
|
4.58%
|
|
15,768
|
4.51%
|
|
441,251
|
5.50%
|
|
|
UPF
|
|
540
|
1.36%
|
|
11,481
|
3.28%
|
|
24,670
|
0.31%
|
|
|
Other Parties (with < 1%)
|
|
141
|
0.36%
|
|
1,208
|
0.35%
|
|
23,594
|
0.29%
|
| Valid Votes
|
39,608
|
93.75%
|
349,678
|
93.54%
|
8,026,322
|
96.03%
|
| Rejected Votes
|
2,642
|
6.25%
|
24,169
|
6.46%
|
581,465
|
6.96%
|
| Total Polled
|
42,250
|
61.29%
|
373,847
|
62.46%
|
8,358,246
|
59.29%
|
| Registered Electors
|
68,937
|
|
598,521
|
|
14,097,690
|
|
| Party
|
Welimada[16]
|
Badulla Electoral District
|
Sri Lanka
|
| Votes
|
%
|
Votes
|
%
|
Votes
|
%
|
|
|
UPFA
|
|
23,040
|
51.75%
|
|
178,634
|
48.26%
|
|
4,223,126
|
45.70%
|
|
|
UNP
|
|
20,441
|
45.91%
|
|
181,705
|
49.09%
|
|
3,486,792
|
37.73%
|
|
|
JHU
|
|
775
|
1.74%
|
|
6,932
|
1.87%
|
|
552,723
|
5.98%
|
|
|
Other Parties (with < 1%)
|
|
266
|
0.60%
|
|
2,907
|
0.79%
|
|
57,589
|
0.62%
|
| Valid Votes
|
44,522
|
92.04%
|
370,178
|
92.47%
|
9,241,931
|
94.52%
|
| Rejected Votes
|
3,851
|
7.96%
|
30,159
|
7.53%
|
534,452
|
5.47%
|
| Total Polled
|
48,373
|
77.64%
|
400,337
|
78.33%
|
9,777,821
|
75.74%
|
| Registered Electors
|
62,308
|
|
511,115
|
|
12,909,631
|
|
| Party
|
Welimada[17]
|
Badulla Electoral District
|
Sri Lanka
|
| Votes
|
%
|
Votes
|
%
|
Votes
|
%
|
|
|
UNP
|
|
24,295
|
53.44%
|
|
201,173
|
53.81%
|
|
4,086,026
|
45.62%
|
|
|
PA
|
|
17,253
|
37.95%
|
|
138,443
|
37.03%
|
|
3,330,815
|
37.19%
|
|
|
JVP
|
|
3,413
|
7.51%
|
|
26,820
|
7.17%
|
|
815,353
|
9.10%
|
|
|
Other Parties (with < 1%)
|
|
498
|
1.10%
|
|
7,401
|
1.98%
|
|
79,391
|
0.89%
|
| Valid Votes
|
45,459
|
93.99%
|
373,837
|
93.35%
|
8,955,844
|
94.77%
|
| Rejected Votes
|
2,908
|
6.01%
|
26,626
|
6.65%
|
494,009
|
5.23%
|
| Total Polled
|
48,367
|
81.06%
|
400,463
|
81.51%
|
9,449,878
|
76.03%
|
| Registered Electors
|
59,666
|
|
491,288
|
|
12,428,762
|
|
| Party
|
Welimada[18]
|
Badulla Electoral District
|
Sri Lanka
|
| Votes
|
%
|
Votes
|
%
|
Votes
|
%
|
|
|
UNP
|
|
19,377
|
44.49%
|
|
167,351
|
46.36%
|
|
3,451,765
|
40.12%
|
|
|
PA
|
|
18,661
|
42.85%
|
|
154,172
|
42.71%
|
|
3,899,329
|
45.33%
|
|
|
NUA
|
|
2,577
|
5.92%
|
|
5,052
|
1.40%
|
|
185,593
|
2.16%
|
|
|
JVP
|
|
1,835
|
4.21%
|
|
16,414
|
4.55%
|
|
518,725
|
6.03%
|
|
|
CWC
|
|
617
|
1.42%
|
|
12,092
|
3.35%
|
|
22,985
|
0.27%
|
|
|
Other Parties (with < 1%)
|
|
486
|
1.12%
|
|
5,935
|
1.64%
|
|
245,839
|
2.86%
|
| Valid Votes
|
43,553
|
N/A
|
361,016
|
N/A
|
8,602,617
|
N/A
|
| Party
|
Welimada[19]
|
Badulla Electoral District
|
Sri Lanka
|
| Votes
|
%
|
Votes
|
%
|
Votes
|
%
|
|
|
UNP
|
|
19,935
|
49.14%
|
|
182,131
|
54.04%
|
|
3,498,370
|
44.04%
|
|
|
PA
|
|
18,811
|
46.37%
|
|
146,546
|
43.48%
|
|
3,887,805
|
48.94%
|
|
|
IND2
|
|
992
|
2.45%
|
|
2,601
|
0.77%
|
|
16,690
|
0.21%
|
|
|
SLPF
|
|
612
|
1.51%
|
|
3,555
|
1.05%
|
|
90,078
|
1.13%
|
|
|
Other Parties (with < 1%)
|
|
219
|
0.54%
|
|
2,226
|
0.66%
|
|
116,737
|
1.47%
|
| Valid Votes
|
40,569
|
92.48%
|
337,059
|
92.19%
|
7,943,688
|
95.20%
|
| Rejected Votes
|
3,300
|
7.52%
|
28,540
|
7.81%
|
400,395
|
4.80%
|
| Total Polled
|
43,869
|
81.78%
|
365,599
|
82.23%
|
8,344,095
|
74.75%
|
| Registered Electors
|
53,643
|
|
444,632
|
|
11,163,064
|
|
| Party
|
Welimada[20]
|
Badulla Electoral District
|
Sri Lanka
|
| Votes
|
%
|
Votes
|
%
|
Votes
|
%
|
|
|
UNP
|
|
14,743
|
53.40%
|
|
135,089
|
58.97%
|
|
2,838,005
|
50.71%
|
|
|
SLFP
|
|
10,521
|
38.11%
|
|
81,011
|
35.36%
|
|
1,785,369
|
31.90%
|
|
|
ELJP
|
|
1,828
|
6.62%
|
|
5,589
|
2.44%
|
|
67,723
|
1.21%
|
|
|
USA
|
|
380
|
1.38%
|
|
5,712
|
2.49%
|
|
141,983
|
2.54%
|
|
|
Other Parties (with < 1%)
|
|
135
|
0.49%
|
|
1,693
|
0.74%
|
|
90,480
|
1.62%
|
| Valid Votes
|
27,607
|
91.93%
|
229,094
|
92.08%
|
5,596,468
|
93.87%
|
| Rejected Votes
|
2,424
|
8.07%
|
19,704
|
7.92%
|
365,563
|
6.13%
|
| Total Polled
|
30,031
|
72.65%
|
248,798
|
75.55%
|
5,962,031
|
63.60%
|
| Registered Electors
|
41,334
|
|
329,321
|
|
9,374,164
|
|
Demographics
Ethnicity
The Welimada Polling Division has a Sinhalese majority (70.8%), a significant Moor population (16.6%) and a significant Indian Tamil population (10.4%) . In comparison, the Badulla Electoral District (which contains the Welimada Polling Division) has a Sinhalese majority (73.0%) and a significant Indian Tamil population (18.5%) [1]
Religion
The Welimada Polling Division has a Buddhist majority (70.6%), a significant Muslim population (16.8%) and a significant Hindu population (11.3%) . In comparison, the Badulla Electoral District (which contains the Welimada Polling Division) has a Buddhist majority (72.6%) and a significant Hindu population (19.3%) [1]
References