Tropical cyclones in 2025
| Tropical cyclones in 2025 | |
|---|---|
| Year boundaries | |
| First system | Dikeledi |
| Formed | December 30, 2024 |
| Strongest system | |
| Name | Erin |
| Lowest pressure | 915 mbar (hPa); 27.02 inHg |
| Longest lasting system | |
| Name | Dikeledi and Taliah |
| Duration | 19 days |
| Year statistics | |
| Total systems | 85 |
| Named systems | 55 |
| Total fatalities | 322 total |
| Total damage | > $4.718 billion (2025 USD) |

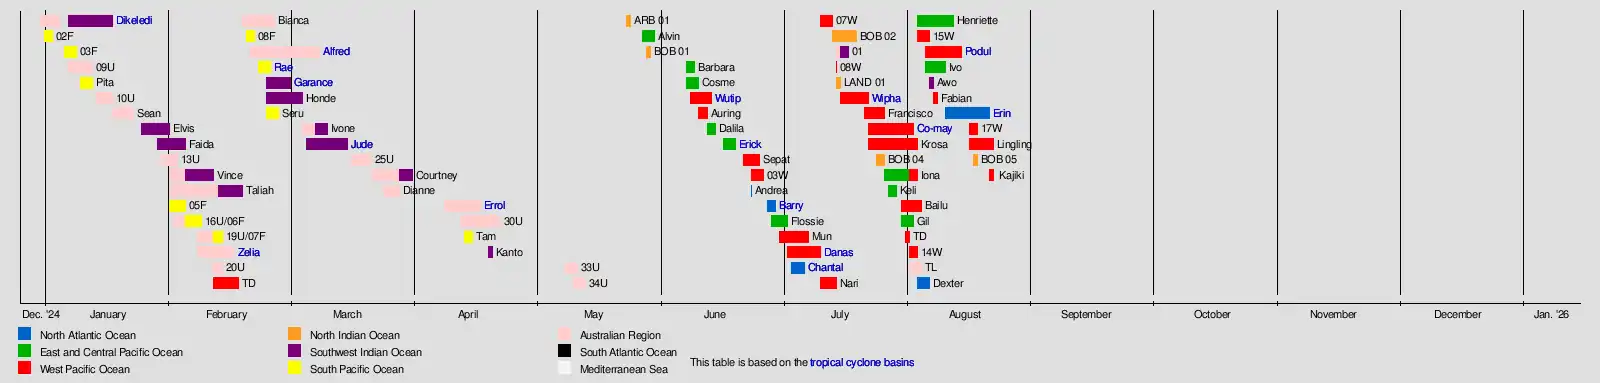
In 2025, tropical cyclones have been forming in seven major bodies of water, commonly known as tropical cyclone basins. Tropical cyclones are named by various weather agencies when they attain maximum sustained winds of 35 knots (65 km/h; 40 mph). The strongest system this year so far is Hurricane Erin, which attained a minimum barometric pressure of 915 hPa (27.02 inHg). The deadliest system so far was a weak depression in the North Indian Ocean which caused 65 deaths in north-east India and Bangladesh. Cyclone Alfred is the costliest system this year so far at $1.18 billion in damage. The accumulated cyclone energy (ACE) index for the year (seven basins combined) so far, as calculated by Colorado State University (CSU), is 312 units overall.[1]
Tropical cyclones are primarily monitored by ten warning centers around the world, which are designated as a Regional Specialized Meteorological Center (RSMC) or a Tropical Cyclone Warning Center (TCWC) by the World Meteorological Organization (WMO). These centers are: National Hurricane Center (NHC), Central Pacific Hurricane Center (CPHC), Japan Meteorological Agency (JMA), Indian Meteorological Department (IMD), Météo-France (MFR), Indonesia's Meteorology, Climatology, and Geophysical Agency (BMKG), Australian Bureau of Meteorology (BoM), Papua New Guinea's National Weather Service (PNGNWS), Fiji Meteorological Service (FMS), and New Zealand's MetService. Unofficial, but still notable, warning centers include the Philippine Atmospheric, Geophysical and Astronomical Services Administration (PAGASA; albeit official within the Philippines), the United States's Joint Typhoon Warning Center (JTWC), and the Brazilian Navy Hydrographic Center.
Global atmospheric and hydrological conditions

Summary
North Atlantic Ocean
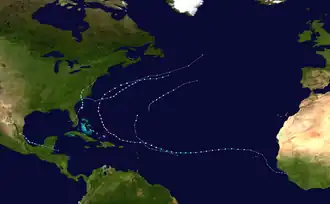
The Atlantic hurricane season officially began on June 1, but the first named storm, Tropical Storm Andrea, didn't form until June 24, which became the latest named storm starting with "A" to form since Hurricane Arthur in 2014, which formed on July 1, but it soon dissipated.[2] Tropical Storm Barry formed on June 29 in the Gulf of Mexico, struck southeastern Mexico, and dissipated only hours after formation, killing 8.[3] Tropical Storm Chantal followed, striking South Carolina with 60 mph winds. Tropical Storm Dexter formed on August 4, dissipating 3 days later. Hurricane Erin formed on August 11 and killed 9 people in Cape Verde, then its structure dramatically improved and strengthed into Category 2 on August 15. It explosively intensified into a Category 5 hurricane on the morning of August 16[4]. Erin's 24-hour intensification was the greatest of any Atlantic hurricane on record based on drop in central pressure before September 1.[5]
Eastern & Central Pacific Oceans
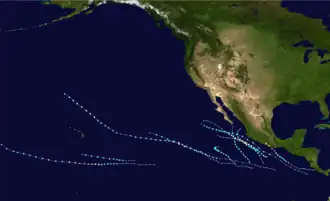
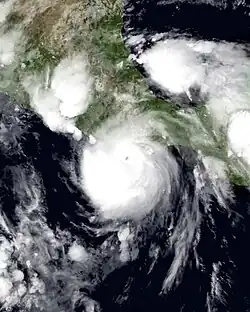
On 28 May, the first system of the Eastern Pacific season, Tropical Depression One-E, formed off the coast of Southern Mexico. The following day, it became the Northern Hemisphere's first named storm of 2025, as Tropical Storm Alvin.[6] It briefly strengthened, before degenerating into a remnant low on 31 May.[7] 2 weeks later, Tropical Storm Barbara formed southwest of Mexico,[8] with Tropical Depression Three-E forming southwest of Barbara, later becoming Tropical Storm Cosme that same day.[9] On the next day, Barbara became the first hurricane of the season,[10] with Cosme peaking at near hurricane strength.[11] On June 10, both systems were in unfavorable environments. Barbara weakened to a tropical storm[12] and Cosme was steadily weakening.[13] Later that day, Barbara weakened to a remnant low,[14] and by the following day, Cosme also became a remnant low.[15] The next day, a low pressure area was designated to Potential Tropical Cyclone Four-E.[16] On June 13, the disturbance soon became a tropical depression,[17] later becoming Tropical Storm Dalila.[18] Dalila encountered the same unfavorable environment, and dissipated after skimming the Pacific Coast of Mexico. Hurricane Erick then formed on June 17 and rapidly intensified into a powerful Category 4 hurricane ahead of landfall in Mexico on June 19. It did so as a Category 3, causing significant damages and 2 deaths before dissipating over land. Its precursor low brought severe flooding to Guatemala, Honduras and El Salvador, killing 17 and causing crop loss and damages. Flossie formed on June 29, becoming the second major hurricane of the season, but affected land minimally as it skimmed the Mexican coast as a Category 3 hurricane. Tropical Depression One-C developed on July 27 and was upgraded to Tropical Storm Iona later that same day. Iona soon strengthened to a hurricane the next day, while Tropical Storm Keli formed just east of it. Tropical Storm Gil formed on July 31, quickly intensifying into a category 1 hurricane late on August 1. Tropical Storm Henriette formed on August 4.
Western Pacific Ocean

A short-lived depression formed on February 11 in the South China Sea. It did not strengthen and dissipated into a tropical low late the next day. The system then brought heavy rains to Vietnam, causing flooding. On June 4 a Tropical Disturbance formed assigned as 92W. As it continued westward to the South China Sea, it briefly strengthened into Tropical Depression 01W. The next day it intensified into Tropical Storm Wutip.[19] On the next day, a tropical depression formed, named Auring by PAGASA the next day.[20] On June 12, Wutip had strengthened to a Severe Tropical Storm after getting more organized. Wutip made landfalls on both Hainan and western Guangdong as a minimal typhoon, as estimated by the JTWC.[21] Auring made landfalls on Taiwan and Eastern China. Auring soon dissipated due to land interaction, with Wutip dissipating after making its second landfall. After 6 days of inactivity, 02W formed north of the Northern Mariana Islands. Wind shear soon decreased, and 02W was improving, letting it intensify to Tropical Storm Sepat. It soon degraded in an increasingly unfavorable environment and dissipated near Japan on June 24. 03W formed in the South China Sea and impacted China and Vietnam, killing six people on June 26.
Tropical Depression 04W formed near the Northern Mariana Islands on July 1, and soon strengthened to Tropical Storm Mun, which peaked at 60 mph as a Severe Tropical Storm. No damage occurred from Mun. Whilst Mun was active, a depression formed in the northeastern South China Sea. It soon strengthened into a tropical storm, named Danas by the JMA or Bising by PAGASA, shortly before it exited the PAR. Danas rapidly intensified into a typhoon before making landfall in Budai in southwestern Taiwan as a Category 3-equivalent storm. It exited to the north of Taiwan and turned west, making two landfalls as a tropical storm in Zhejiang. Following Danas was Severe Tropical Storm Nari, which took a similar track to Mun, but made landfall as a weakening storm in Hokkaido. At the same time, a depression formed in the East China Sea, designated Tropical by the JMA but subtropical by the JTWC. It was initially expected to strengthen slightly, but made landfall over Kyushu without reaching storm status. The JTWC recognized a fast-moving tropical storm that formed near the Ogasawara Islands on July 15, unofficially making a landfall on Japan the same day. It then dissipated without being recognized by the JMA, mostly due to its incomplete low-level circulation. The next day, a tropical depression formed east of the Philippines, named Crising by PAGASA. The JMA soon upgraded it to a tropical storm, naming it Wipha. The JTWC followed suit the next day, and the JMA declared it a severe tropical storm on July 19. It made landfall in southern China on July 20, after extreme preparations were taken, including Wind Signal No.10, the highest possible state, in Hong Kong. The JTWC estimated it as a Typhoon at landfall. Wipha emerged into the Gulf of Tonkin and briefly restrengthened before landfall in Vietnam. It dissipated the next day. Within the next few days, three more systems formed, Francisco, Co-may, and Krosa. Francisco formed east of Kyushu Island, and moved westward before degrading into a remnant low before making a landfall due to a Fujiwhara effect with Co-may, which formed west of northern Luzon and turned northeastward due to Francisco, making landfall as a Typhoon before degrading into a depression. After Francisco dissipated, Co-may began to restrengthen near where Francisco formed. It fluctuated between Storm and Depression status on July 27 and 28. Meanwhile, Krosa formed near Guam and strengthened to a Typhoon, before dry air intrusion caused it to weaken to a tropical storm by JTWC, but not according to the JMA.
North Indian Ocean

A Depression formed in the Arabian Sea off the coast of Konkan, named ARB 01. It made a landfall on India soon after, bringing heavy rain to the region after degrading into a tropical low. It peaked with 30 mph 3-min winds and a minimum barometric pressure of 997 hPa (mbar). On May 29, Depression BOB 01 formed near West Bengal. It strengthened into a Deep Depression three hours later on the IMD scale. It made landfall on the border of West Bengal and Bangladesh 6 hours later at its peak of 35 mph 3-min winds and a minimum barometric pressure of 988 hPa (mbar). It weakened and dissipated over Bangladesh over the next 36 hours, bringing heavy rain to the region. 65 people died from the resulting landslides and flooding.
After a lull in activity, Depression BOB 02 formed over West Bengal on July 14 from a well-marked low that moved inland a day prior. The next day, another depression was designated LAND 01. It quickly dissipated after forming over Northwestern India. BOB 02 dissipated but soon regenerated, causing it to be assigned a new name, LAND 03, despite there being no recorded evidence of a LAND 02. Soon after it dissipated for good, a new Depression emerged in the extreme northern Bay of Bengal, designated as BOB 04, but, similar to BOB 02/LAND 03, there was no evidence of a BOB 03. It moved inland and soon dissipated, but brought extreme rain and flooding to the affected areas. The remnants of Wipha crossed the North Indian basin and concentrated into depression BOB 04, causing most of the parts of the city being waterlogged.
South-West Indian Ocean
January – June

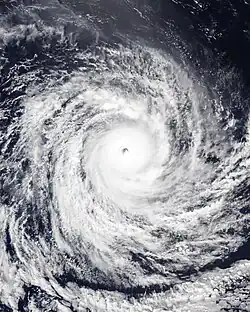
Dikeledi formed on 6 January, gradually intensifying over the next four days until making landfall in Northern Madagascar as a Category 2 equivalent cyclone on 11 January. The cyclone weakened to a tropical storm south of Mayotte before rapidly strengthening back to Category 2 intensity, making landfall near Nacala at that strength on 13 January. In late January, two tropical cyclones formed; one of them was the moderate Tropical Storm Faida, which brought heavy rainfall to Madagascar on 5 February. After Faida dissipated, Tropical Cyclone Vince entered the basin from the Australian region on 4 February. Four days later, it became the most intense cyclone of the season and the first very intense tropical cyclone since Cyclone Freddy two years before. At 12 February, Vince had transitioned to being extratropical. At the same day, Taliah had entered the basin fluctuating between a moderate tropical storm and a strong tropical storm before becoming a post-tropical cyclone at 18 February. Six days later, Garance and Honde had formed, Garance receiving its name the day after. Garance intensified rapidly into an Intense Tropical Cyclone, making landfall at Réunion at 28 February as a Category 2. Honde brought heavy rainfall to Mozambique and then southern Madagascar as a Category 1. Jude formed as a disturbance south of the Chagos Islands on 6 March. It intensified at 8 March, receiving its name. Ivone entered the basin on 8 March and on the same day intensified to a Moderate Tropical Storm and received its name. Jude made landfall in Mozambique as a Category 1 at 10 March. Courtney from the Australian region entered the basin on 29 March, becoming an intense tropical cyclone. After nearly a month of inactivity, on 20 April Subtropical storm Kanto was named reaching a peak intensity of 75 km/h (10 minute sustained) winds with a central pressure of 993 hPa. This was the first subtropical storm named by Météo-France, which added the subtropical cyclone category starting with this cyclone season.
July – December

On 16 July, a tropical low crossed over from the Australian Region and organized into a depression. It did not strengthen, nor was it expected to, and it dissipated on 18 July. The JTWC designation was a tropical storm. On the 7 August, a tropical disturbance formed well north of the Mascarenes, later that day it was upgraded to a tropical depression then subsequently named Awo that evening. Awo is the first named storm to form in August within the South-West Indian Ocean basin since Severe Tropical Storm Aline in 1969, though Severe Tropical Storm Tony did enter the basin during August in 1979.
Australian Region
January – June

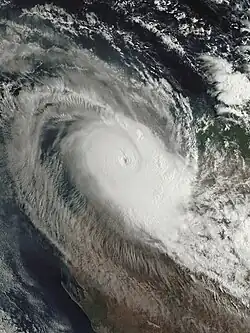
The first half of January had Tropical Lows 09U and 10U. The latter half had Sean, 13U, Taliah, and Vince. On 17 January, the BoM designated Tropical Low 11U, which absorbed 10U, and later named Sean on 19 January. A day later, the storm rapidly intensified to a Category 4 major cyclone on the Australian cyclone scale, possessing a distinct eye and intense winds. Sean dissipated a couple days later. The cyclone caused heavy rainfall and gale-force winds across portions of Western Australia. A record amount of rain fell in Karratha, with 274.4 mm recorded within 24 hours on 20 January. Tropical Low 13U briefly tracked along the coast of Queensland and flooding killed a 63-year-old woman. On 31 January, the BoM designated Tropical Lows 14U and 15U, which were later named Taliah and Vince. After dealing with moderate wind shear, on 3 February, Taliah peaked as a Category 3 severe tropical cyclone on the Australian cyclone scale and Category 2 on the SSHWS scale. Taliah exited the basin on 12 February. Vince was named on 2 February and also intensified to a Category 3 on the Australian cyclone scale before exiting BoM area of responsibility on 4 February. February started with Tropical Lows 16U and 19U, though both disturbances exited the basin and entered the Fiji Meteorological Service area of responsibility. Meanwhile, the BoM designated Tropical Low 18U on 7 February, which was named Zelia on 11 February. Two days later, Zelia underwent rapid intensification due to warm sea surface temperatures and relatively low wind shear. At 00:00 UTC 13 February, Zelia intensified to a Category 4 severe tropical cyclone and later to Category 5 intensity. Afterward, the cyclone stalled and underwent an eyewall replacement cycle (EWRC), which ended its rapid intensification phase. Radar imagery showed an EWRC, which was later completed before landfall near De Grey, northeast of Port Hedland. On 18 February, the Bureau of Meteorology designated Tropical Low 21U in the eastern side of the Indian Ocean. BOM later named the system Tropical Cyclone Bianca. On 20 February, a tropical low was spotted by the Bureau of Meteorology in the Coral Sea. The disturbance, initially designated by the agency as 22U, was noted to likely develop into a tropical cyclone over the next several days. Two days later, BOM upgraded the system to a category 1, with the name Alfred being assigned to it. On 25 February, Bianca peaked as a Category 4 severe tropical cyclone on the Australian cyclone scale and Category 3 on the SSHWS scale. Afterward, increasing wind shear and cooler sea surface temperatures caused the storm to rapidly weaken, dissipating on 27 February. Over the next couple of days, Alfred continued to gradually move to the east, and was upgraded to a Category 2 tropical cyclone in the Australian scale at 16:00 AEST on 24 February. As Alfred turned south, it intensified to Category 3 status on 26 February at 22:00 AEST. The next day, the BOM further upgraded Alfred to a Category 4 cyclone, with a small eye appearing on visible satellite imagery. Later that night, an eyewall replacement cycle (ERC) occurred, prompting Alfred to fluctuate between Categories 3 and 4 on 1 March, before further weakening down to a Category 1 the following day. The cyclone then restrengthened slightly to Category 2 status by 3 March, before being downgraded to Category 1 intensity on 8 March. Alfred made landfall at Moreton Island on 01:00 AEST March 8 as a Category 1 tropical cyclone, and was downgraded to a tropical low five hours later. Tropical Low 23U formed on 4 March before exiting the basin on 8 March. The system later intensified into Tropical Storm Ivone in the South-West Indian Ocean. Tropical Cyclone 25U formed on 17 March before dissipating on 21 March. Tropical Low 27U formed on 22 March and strengthened into Tropical Cyclone Courtney three days later. Afterward, Courtney intensified to a Category 5 cyclone on the Australian cyclone scale before entering the South-West Indian Ocean on 29 March. Tropical Cyclone Dianne formed near North Australia on 28 March and made landfall near Derby on 29 March. On 8 April, Tropical Low 29U formed in the Arafura Sea. Three days later, JTWC designated Tropical Cyclone 29S. Later on 15 April, 29S was designated as Errol by BoM. Shortly after the designation, the cyclone explosively intensified to a powerful Category 5 equivalent cyclone with peak winds of 260 km/h and 919 hPa according to the JTWC. Tropical Low 30U formed in the Arafura Sea on 13 April. On 18 April, JTWC designated 30U as 31P. It was expected to strengthen, but wind shear soon caused it to dissipate on 23 April. On 9 May 2025, Tropical Low 33U formed near Papua New Guinea. During 11 May, this system was upgraded to a tropical storm by the JTWC and named 32P. On the same date, Tropical Low 34U formed near the Solomon Islands. 33U dissipated the next day. 34U meandered around the southern Solomon Sea but dissipated the next day. Its remnants were absorbed by a nontropical system to the south.
July – December
The season began with a tropical low in TCWC Jakarta's area of responsibility on 15 July. It moved into the South-West Indian Ocean a day later.
South Pacific Ocean
January – June

Tropical Disturbance 03F was designated on 5 January and stayed out to sea moving southeastwards before dissipating 3 days later.
The first named storm of the season, Tropical Cyclone Pita formed on 9 January. The storm dropped heavy rains that resulted in flooding across Samoa and Fiji, isolated flooding occurred in the latter nation including the collapse of a bridge.[22]
After a long pause in activity, two Tropical Depressions (05F and 07F) were monitored in early and mid-February. 06F however failed to reach Tropical Depression status. Tropical Depression 08F were monitored later that month. On 22 February Tropical Cyclone Rae developed passing just east of Fiji. On 23 February, the Fiji Meteorological Service named Tropical Cyclone Rae. Rae peaked on 25 February with winds of 110 km/h and 975 hpa. A few days later on 24 February, Tropical Cyclone Seru formed north of most islands of Vanuatu. Seru peaked with 110 km/h and 980 hpa on 25 February. Rae turned post-tropical on 26 February and Seru degenerated into a remnant low on 1 March, respectively. Late season activity edit After a second, even more significant lull in activity, Tropical Cyclone Tam was named on 14 April by the Fiji Meteorological Service. It intensified into a deep subtropical cyclone by 16 April, bringing severe weather and flooding to northern New Zealand and causing 5 deaths in New South Wales in Australia.[23]
July – December
South Atlantic Ocean
Systems
January
In January, the Intertropical Convergence Zone (ITCZ), which allows for the formation of tropical waves, is located in the Southern Hemisphere, remaining there until May.[24] This limits Northern Hemisphere cyclone formation to comparatively rare non-tropical sources.[25] In addition, the month's climate is also an important factor. In the Southern Hemisphere basins, January, at the height of the austral summer, is the most active month by cumulative number of storms since records began. Of the four Northern Hemisphere basins, none is very active in January, as the month is during the winter, but the most active basin is the Western Pacific, which occasionally sees weak tropical storms form during the month.[26] January was unusually active, with twelve systems forming and seven storms getting named.
The month started off in the South-West Indian Ocean with Cyclone Dikeledi, which intensified into a major cyclone before it made two landfalls at Antsiranana, Madagascar and Nampula Province, Mozambique, Cyclone Elvis and Cyclone Faida also formed but was downgraded into a depression by MFR in post-storm analysis. Meanwhile, short-lived Cyclone Pita formed on January 6, affecting some islands in the South Pacific basin. Weeks later, in the Australian basin, Cyclone Sean developed on January 17. Sean rapidly intensified into a Category 3-tropical cyclone, marking it the second major tropical cyclone of the year after Dikeledi. Cyclone Taliah and Cyclone Vince formed as well, with the latter rapidly intensifying into a Very Intense Tropical Cyclone in the South-West Indian Ocean, making it the strongest cyclone this month.
| Storm name | Dates active | Max wind km/h (mph) |
Pressure (hPa) |
Areas affected | Damage (USD) |
Deaths | Refs |
|---|---|---|---|---|---|---|---|
| Dikeledi | December 30, 2024 – January 17 | 175 (110) | 945 | Madagascar, Mayotte, Mozambique, Comoros, Europa Island | >$20 million | 9 | [27][28][26] |
| 02F | December 31 – January 2 | Unknown | 1006 | None | None | None | |
| 03F | January 5–8 | Unknown | 997 | Samoa, Niue | None | None | |
| 09U | January 6–12 | 75 (45) | 1000 | None | None | None | |
| Pita | January 6–12 | 65 (40) | 995 | Tonga, Niue, Cook Islands | None | None | |
| 10U | January 13–17 | 30 (15) | 1006 | None | None | None | |
| Sean | January 17–22 | 175 (110) | 945 | Broome, Port Hedland, Western Australia | None | None | [29] |
| Elvis | January 24–31 | 85 (50) | 990 | Mozambique, Madagascar | None | None | |
| Faida | January 28 – February 4 | 55 (35) | 998 | Mascarene Islands, Madagascar | None | None | |
| 13U | January 29 – February 1 | 55 (35) | 999 | Queensland | None | 1 | |
| Vince | January 31 – February 11 | 220 (140) | 923 | Rodrigues, Île Amsterdam | None | None | |
| Taliah | January 31 – February 18 | 140 (85) | 965 | None | None | None | |
| 05F | January 31 – February 5 | Unknown | 1000 | Loyalty Islands, Vanuatu | None | None |
February
February was extremely active. It was the most active month, and one of the third-most active months in any given year on record, with twelve systems forming and seven storms getting named. A total of seven tropical cyclones reached Category 3 strength or higher, the highest number since records began in 2003.
Historically, February is normally similar to January in terms of activity, with most formations being effectively restricted to the Southern Hemisphere (with the exception of the rare Western Pacific disturbance this year). The month also tends to see more strong tropical cyclones forming compared to January, despite seeing marginally fewer overall storms, due to the monsoon being at its height in the Southern Hemisphere.[26] In the Northern Hemisphere, February is the least active month, with no Eastern or Central Pacific tropical cyclones[30] and only one Atlantic tropical cyclone having ever formed in the month. Even in the Western Pacific, February activity is low: in 2025, the month never saw a typhoon-strength storm, the last being Typhoon Higos in 2015.
The month started off active with five systems forming in January and then persisting into February: Faida, 13U, Vince, Taliah, and 05F. Cyclone Zelia formed on February 7 near the Kimberley region, and rapidly intensified into a Category 5 severe tropical cyclone six days later; it then made landfall near De Grey in Australia as a Category 4 tropical cyclone.[31] A weak depression briefly existed in the South China Sea. Two tropical cyclones formed in the Australian region on February 20 – Bianca and Alfred – while in the South-West Indian Ocean, two cyclones also formed near Madagascar: Garance and Honde. The former eventually became an intense tropical cyclone on February 27 before making landfall in the northern part of Réunion the next day as a slightly weaker tropical cyclone.
| Storm name | Dates active | Max wind km/h (mph) |
Pressure (hPa) |
Areas affected | Damage (USD) |
Deaths | Refs |
|---|---|---|---|---|---|---|---|
| 16U/06F | February 1–8 | 75 (45) | 996 | None | None | None | |
| 19U/07F | February 7–13 | 75 (45) | 998 | Queensland, New Caledonia | None | None | |
| Zelia | February 7–14 | 215 (130) | 927 | Kimberley, Pilbara | $733 million | None | |
| 20U | February 11–13 | Unknown | 1002 | None | None | None | |
| TD | February 11–17 | 55 (35) | 1006 | Vietnam, Malaysia, Singapore, Philippines (Palawan) | None | None | |
| Bianca | February 18–26 | 175 (110) | 954 | None | None | None | |
| 08F | February 19–22 | 65 (40) | 998 | None | None | None | |
| Alfred | February 21 – March 9 | 165 (105) | 951 | Willis Island, South East Queensland, northeastern New South Wales | >$1.18 billion | 1 | |
| Rae | February 22–26 | 110 (70) | 975 | Fiji, Wallis and Futuna, Tonga | None | None | |
| Garance | February 24 – March 2 | 175 (110) | 951 | Northern Madagascar, Réunion, Mauritius | $1.05 billion | 5 | |
| Honde | February 24 – March 5 | 120 (75) | 968 | Mozambique, Madagascar | Unknown | 3 | |
| Seru | February 24–27 | 110 (70) | 980 | Fiji, Vanuatu | None | None |
March
During March, activity tends to be lower than in preceding months. In the Southern Hemisphere, the peak of the season has normally already passed, and the monsoon has begun to weaken, decreasing cyclonic activity, however, the month often sees more intense tropical cyclones than January or February.[26] Meanwhile, in the Northern Hemisphere basins, sea surface temperatures are still far too low to normally support tropical cyclogenesis. The exception is the Western Pacific, which usually sees its first storm, often a weak depression, at some point between January and April.
March was slightly inactive, featuring five storms, four of which were named. Cyclone Alfred, Honde, and Garance formed in February and persisted into March. The strongest storm of the month is Cyclone Courtney. At the start of the month, Cyclone Jude caused 21 deaths, 4 missing people, and around 130 people injured in Southeastern Africa, primarily Mozambique and Madagascar. Alfred stalled for a day on March 5 about 333 kilometers (107 miles) away from Brisbane, Australia, as a tropical storm (a Category 2 on the Australian scale). An unnamed but tagged tropical cyclone, Cyclone 26S (or 25U) roamed near the Cocos (Kneeling) Islands with its convection mainly on its Western side. And cyclone Dianne formed south of the Ashmore & Cartier Islands on March 28 and was designated the name "Dianne" on the same day at 06:00 UTC. Dianne made landfall near Derby, Australia about 37 miles (60 kilometers) on March 29, causing minimal impacts. Cyclone Courtney began weakening towards the end of March, and dissipated on April 2.
| Storm name | Dates active | Max wind km/h (mph) |
Pressure (hPa) |
Areas affected | Damage (USD) |
Deaths | Refs |
|---|---|---|---|---|---|---|---|
| Jude | March 6–16 | 140 (85) | 970 | Madagascar, Mayotte, Comoros, Mozambique | >$110 million | 21 | [32][33][34] |
| Ivone | March 6–11 | 95 (60) | 981 | None | None | None | |
| 25U | March 17–22 | 85 (50) | 991 | Indonesia, Christmas Islands, Cocos Islands | None | None | |
| Courtney | March 22–31 | 205 (125) | 934 | Indonesia | None | None | |
| Dianne | March 25–29 | 95 (60) | 984 | Western Australia, Northern Territory | None | None |
April
.jpg)
The factors that begin to inhibit Southern Hemisphere cyclone formation in March are even more pronounced in April, with the average number of storms formed being hardly half that of March.[26][35] However, even this limited activity exceeds the activity in the Northern Hemisphere, which is rare, with the exception of the Western Pacific basin. All Pacific typhoon seasons between 1998 and 2016 saw activity between January and April, although many of these seasons saw only weak tropical depressions.[36] By contrast, only two Atlantic hurricane seasons during those years saw tropical cyclone formation during that period.[37] With the combination of the decreasing temperatures in the Southern Hemisphere and the still-low temperatures in the Northern Hemisphere, April and May tend to be the least active months worldwide for tropical cyclone formation.[35]
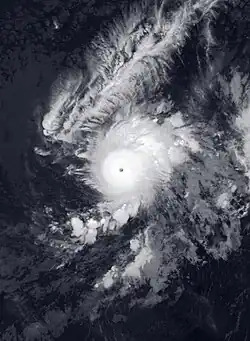
April 2025 was an example of this phenomenon, seeing four storms forming, three being named. The month started off in the Australian basin with the formation of Cyclone Errol, which would later become the first Category 5 equivalent cyclone of the year, and was the strongest cyclone of the month. Following that was the formation of Tropical Low 30U. In the South Pacific basin, Cyclone Tam formed and briefly impacted Vanuatu. On 20 April, Kanto formed, become the first subtropical cyclone in the South-west Indian Ocean since subtropical storm Issa in April 2022.
| Storm name | Dates active | Max wind km/h (mph) |
Pressure (hPa) |
Areas affected | Damage (USD) |
Deaths | Refs |
|---|---|---|---|---|---|---|---|
| Errol | April 9–18 | 205 (125) | 936 | Maluku, Kimberley | None | None | |
| 30U | April 13–23 | 65 (40) | 998 | Maluku, Queensland, Top End | None | None | |
| Tam | April 14–16 | 85 (50) | 986 | Vanuatu, New Zealand | None | None | [38] |
| Kanto | April 20–21 | 75 (45) | 993 | None | None | None |
May
Around the middle of May, the Intertropical Convergence Zone (ITCZ), which allows for the formation of tropical waves and has previously remained in the Southern Hemisphere for the first five months of the year, moves to the Northern Hemisphere, allowing the northern cyclone seasons to start in earnest.[24] Without the presence of the ITCZ, Southern Hemisphere cyclones must form from non-wave sources, which are rarer.[25] For that reason, cyclone formation is relatively sparse, with May tending to be the month of the final storm in each of the three basins. Meanwhile, more intense storms are nearly unheard of, with the South-West Indian Ocean having seen only one intense tropical cyclone and no very intense tropical cyclones in the month, and the other two basins having similar levels of activity in May. In the Northern Hemisphere, May is the first month most basins see activity, due to the new presence of the ITCZ. The Pacific hurricane season begins on May 15, and although the Atlantic hurricane season officially begins on June 1, off-season storms are very common, with over half of the 21st century seasons seeing a storm form in May.[39] Although the North Indian Ocean has no official start or end date, due to the monsoon, mid-May is the beginning of a month-long period of high activity in the basin. Even in the Western Pacific, activity tends to increase throughout May.
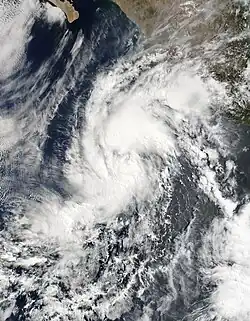
May was a below average month featuring five cyclones, with only one named. Around the approaching middle portions of the month, Tropical Lows 33U & 34U were offseason lows in the Australian region, the former formed near Papua New Guinea and was marked 32P by the JTWC, while the latter formed near the Solomon Islands. By the latter parts of the month, ARB 01 formed off the western Indian coast and moved inland. Tropical Storm Alvin formed in the Eastern Pacific and dissipated while approaching the Baja California peninsula, it was also the strongest of the month. BOB 01 was the second North Indian cyclone to form in May, showing the signs of increasing activity alongside ARB 01 in the North Indian Ocean during this month, BOB 01 primarily impacted Bangladesh and East India, it is so far the deadliest tropical cyclone of the year.
| Storm name | Dates active | Max wind km/h (mph) |
Pressure (hPa) |
Areas affected | Damage (USD) |
Deaths | Refs |
|---|---|---|---|---|---|---|---|
| 33U | May 9–12 | 65 (40) | 1000 | Papua New Guinea, Indonesia (South Papua) | None | None | |
| 34U | May 11–14 | 45 (30) | 1003 | Solomon Islands, Rennell Island | None | None | |
| ARB 01 | May 24–25 | 45 (30) | 997 | Western India, South India, Lakshadweep | Unknown | None | |
| Alvin | May 28–31 | 95 (60) | 999 | Central America, Baja California Peninsula, Western Mexico | >629,000 | None | [40] |
| BOB 01 | May 29–30 | 55 (35) | 988 | East India, Bangladesh, Northeast India, Myanmar, Bhutan | Unknown | 65 | [41][42][43][44][45] |
June
June was very active with eleven tropical cyclones forming, ten of which have been named, nine of them officially received such. Hurricane Barbara, Tropical Storm Cosme, Tropical Storm Dalila, and Hurricane Erick formed in the eastern Pacific, the latter becoming the first major hurricane in the Northern Hemisphere in the year. In the Western Pacific, Tropical Storm Wutip formed in the South China Sea and crossed Hainan before reaching South China. Tropical Depression Auring formed a few days later that month, passing near the Philippines before crossing Taiwan and reaching East China. Tropical Storm Sepat formed in the Pacific Ocean southeast of Japan. On June 24, a short-lived Tropical Storm Andrea formed in the Subtropical Atlantic, also on that day a tropical disturbance formed near the Philippines in the South China Sea, and the next day became a tropical depression tagged 03W, making landfall in Hainan and the Leizhou Peninsula on the eastern side, nearly 2 weeks after Wutip made landfall on the western side. On 27 June, a new tropical disturbance in the Gulf of Honduras has been designated by the NHC,[46] causing scattered heavy rain across eastern Mexico and Guatemala. Mainly light rainfall fell over Central America, particularly Honduras and Costa Rica. It later became Tropical Storm Barry on 29 June in the Gulf of Mexico. Tropical Storm Flossie also formed on the same day near the Pacific coast of Mexico, persisting into the next month, July.
| Storm name | Dates active | Max wind km/h (mph) |
Pressure (hPa) |
Areas affected | Damage (USD) |
Deaths | Refs |
|---|---|---|---|---|---|---|---|
| Barbara | June 8–11 | 120 (75) | 991 | Southwestern Mexico | None | None | |
| Cosme | June 8–11 | 110 (70) | 992 | None | None | None | |
| Wutip | June 9–15 | 110 (70) | 980 | Philippines, Vietnam, Cambodia, Laos, Thailand, South China, East China, Hong Kong, Macau | >$253 million | 17 | [47][48][49][50] |
| Auring | June 11–13 | 55 (35) | 1004 | Philippines, Taiwan, Central China, East China | Unknown | 1 | [51] |
| Dalila | June 13–15 | 100 (65) | 993 | Southwestern Mexico | $39.4 million | None | |
| Erick | June 17–21 | 230 (145) | 939 | Honduras, Guatemala, Southern Mexico | >$250 million | 23 | [52] |
| Sepat | June 22–26 | 65 (40) | 1001 | Japan (Bonin Islands, Izu Islands) | None | None | |
| 03W | June 24–27 | 55 (35) | 1002 | Philippines, South China, Vietnam, Hong Kong, Macau | Unknown | 6 | [53][54] |
| Andrea | June 24–24 | 65 (40) | 1014 | None | None | None | |
| Barry | June 28–30 | 75 (45) | 1006 | Belize, Yucatán Peninsula, Eastern Mexico, USA (Texas) | >$5.97 million | 8 | Main article: July 2025 Central Texas floods |
| Flossie | June 29 – July 3 | 185 (115) | 962 | Southwestern Mexico, Revillagigedo Islands | Unknown | 1 |
July
July was abnormally active compared to the previous year, featuring 18 systems, with only 12 of them being named; this month includes Mun, Danas, Chantal, Nari, Wipha, Francisco, Co-may, Krosa, Iona, Keli, Gil, and Bailu with Iona being the strongest in the month of July (2025). Flossie became the second major hurricane in the Northern Hemisphere, which had formed in June and persisted into the current month. Mun had formed in the open Pacific Ocean with an erratic path, while Danas dropped heavy rain across Taiwan. Chantal moved up north, affecting the Carolinas. Nari made landfall on Hokkaido whilst weakening, and Wipha moved toward China, the remnants of Wipha concentrated into a depression over North Indian Ocean and became BOB 04. Also, notably, Tropical Depression 01 formed in the South-West Indian Ocean on July 16, becoming the first tropical depression or stronger there in July since 2016. Wipha, Francisco and Co-may enhanced the southwest monsoon, producing floods in Philippines slightly similar to Gaemi in 2024. Co-may formed north of the Philippines and striked Pangasinan since 2009, due to interaction with Francisco which caused to loop northeast towards the Ilocos Region. In the Central Pacific, Hurricane Iona and Tropical Storm Keli formed in the Central Pacific. Iona strengthened to a major hurricane. Gil formed in the Eastern Pacific while Bailu formed in the West Pacific on July 31 and both of them persisted into the next month, August.
| Storm name | Dates active | Max wind km/h (mph) |
Pressure (hPa) |
Areas affected | Damage (USD) |
Deaths | Refs |
|---|---|---|---|---|---|---|---|
| Mun | July 1–8 | 95 (60) | 990 | None | None | None | |
| Danas (Bising) | July 3–11 | 120 (75) | 970 | Philippines, Taiwan, South China, East China, Hong Kong, Japan (Ryukyu Islands), Macau | $113 million | 10 | [55][56][57] |
| Chantal | July 4–7 | 95 (60) | 1002 | Southeastern United States, Mid-Atlantic, Northeastern United States, Atlantic Canada | $56 million (Per local officials) | 6 | |
| Nari | July 11–15 | 95 (60) | 985 | Japan (Kuril Islands, Bonin Islands, Izu Islands, East, North), Alaska | $1 million | None | |
| 07W | July 11–14 | 55 (35) | 992 | Taiwan, China (Zhejiang), West Japan, Korea | Unknown | None | |
| BOB 02/LAND 03 | July 14–20 | 45 (30) | Unknown | East India, Myanmar, Northeast India, Bangladesh, Central India, Northwest India | Unknown | None | |
| 01 | July 15–18 | 55 (35) | 1001 | None | None | None | |
| 08W | July 15 | 85 (50) | 1001 | Japan (Izu Islands, Kuril Islands, North, Northeast, East) | Unknown | None | |
| LAND 01 | July 15–16 | 35 (25) | Unknown | Northwest India, Pakistan | Unknown | None | |
| Wipha (Crising) | July 16–23 | 110 (70) | 970 | Philippines, Taiwan, South China, Hong Kong, Macau, Vietnam, Laos, Cambodia, Myanmar | $819 million | 56 | [58][59][60][61] |
| Francisco (Dante) | July 22–27 | 75 (45) | 990 | Philippines, Japan (Ryukyu Islands), Taiwan, East China | Unknown | None | |
| Co-may (Emong) | July 23 – August 3 | 120 (75) | 975 | Philippines, Taiwan, Japan (Ryukyu Islands), East China, Central China, Korea | $73 million | 55 | [62][63][64] |
| Krosa | July 23 – August 4 | 140 (85) | 965 | Guam, Northern Mariana Islands, Japan (Bonin Islands, Izu Islands Kantō region) | Minimal | None | |
| BOB 04 | July 25–27 | 45 (30) | 988 | Myanmar, Bangladesh, Central India, East India | None | None | |
| Iona | July 27 – August 4 | 205 (125) | 957 | None | None | None | |
| Keli | July 28–30 | 65 (40) | 1006 | None | None | None | |
| Bailu | July 31 – August 5 | 65 (40) | 994 | Japan (Ryukyu Islands. Izu Islands) | None | None | |
| Gil | July 31 – August 3 | 120 (75) | 991 | None | None | None |
August
August tends to be the month where the frequency of tropical cyclones in the Northern Hemisphere starts to increase, mostly due to decreasing wind shear, very warm ocean temperatures, and Saharan dust beginning to play a lesser role in drying out systems.[65] The August of 2025 is the first time that ten or more systems had been formed in a single week on the month of August.
Co-may, Krosa, Iona, Gil, and Bailu formed in July and persisted into August. 14 systems formed so far, with nine of them named, including: Dexter, Henriette, Podul, Ivo, Awo, Fabian, Erin, Lingling, and Kajiki with Erin being the strongest in this 2025 season and this month, and also the first hurricane in the Atlantic basin.
| Storm name | Dates active | Max wind km/h (mph) |
Pressure (hPa) |
Areas affected | Damage (USD) |
Deaths | Refs |
|---|---|---|---|---|---|---|---|
| TD | August 1–2 | Unknown | 996 | Unknown | Unknown | None | |
| 14W | August 2–4 | Unknown | 1010 | None | None | None | |
| TL | August 2–5 | 55 (35) | 1005 | None | None | None | |
| Dexter | August 4–7 | 85 (50) | 998 | None | None | None | |
| Henriette | August 4–13 | 140 (85) | 986 | None | None | None | |
| 15W | August 4–6 | Unknown | 1006 | None | None | None | |
| Podul (Gorio) | August 6–15 | 150 (90) | 960 | Northern Mariana Islands, Philippines, Ryukyu Islands, Taiwan, East China, South China, Hong Kong, Macau | $14.3 million | 2 | [66][67] |
| Ivo | August 6–11 | 100 (65) | 999 | Southwestern Mexico, Revillagigedo Islands, Baja California Sur | >$58,000 | None | |
| Awo | August 7–8 | 65 (40) | 1000 | Agaléga | None | None | |
| Fabian | August 7–9 | Unknown | 1006 | Philippines | None | None | |
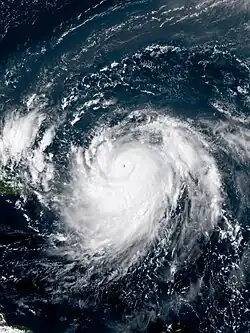
| Erin | August 11–present | 260 (160) | 915 | Cape Verde, Lesser Antilles, Puerto Rico, Hispaniola, Lucayan Archipelago | Unknown | 10 | [68][69][70] |
| 17W | August 17–19 | 55 (35) | 1000 | South China, Vietnam, Hong Kong, Macau | None | None | |
| Lingling (Huaning) | August 17–present | 75 (45) | 998 | Ryukyu Islands, Kyūshū | None | None | |
| BOB 05 | August 18–19 | 35 (25) | 993 | East India | None | None | |
| Kajiki (Isang) | August 22–present | 65 (40) | 998 | Philippines | None | None |
Global effects
There are a total of seven tropical cyclone basins that tropical cyclones typically form in this table, data from all these basins are added.[71]
- ^ a b The wind speeds for this tropical cyclone/basin are based on the Saffir Simpson Scale which uses 1-minute sustained winds.
- ^ a b c d Only systems that formed either before or on December 31, 2025 are counted in the seasonal totals.
- ^ a b Tropical Storm 08W was recognized by the Joint Typhoon Warning Center (JTWC), which is included in this table even though it was not named by the Japan Meteorological Agency.
- ^ a b Iona crossed into the Western Pacific basin according to JTWC and JMA, but it will not be counted on total of systems because the system was formed on Central Pacific.
- ^ The wind speeds for this tropical cyclone/basin are based on the IMD Scale which uses 3-minute sustained winds.
- ^ a b c Only systems that formed either on or after January 1, 2025 are counted in the seasonal totals.
- ^ The wind speeds for this tropical cyclone are based on Météo-France, which uses wind gusts.
- ^ Although two systems formed in this basin, there are three named storms because after Tropical Low 08U moved into this basin, it was given a name, Dikeledi, by the MFR.
- ^ According to the BoM, Cyclones Vince, Taliah and Courtney entered the South-West Indian ocean basin from the Australian region
- ^ The sum of the number of systems in each basin will not equal the number shown as the total. This is because when systems move between basins, it creates a discrepancy in the actual number of systems.
See also
- Tropical cyclones by year
- List of earthquakes in 2025
- Tornadoes in 2025
- Weather of 2025
- NOAA under the second presidency of Donald Trump
References
- ^ "Real-Time Global Tropical Cyclone Activity".
- ^ Masters, Jeff (June 24, 2025). "Tropical Storm Andrea forms in the remote central Atlantic". New Haven, Connecticut: Yale Climate Connections. Retrieved June 24, 2025.
- ^ Henson, Jeff Masters, Bob (2025-06-30). "Tropical Storm Barry has come and gone » Yale Climate Connections". Yale Climate Connections. Retrieved 2025-07-04.
{{cite web}}: CS1 maint: multiple names: authors list (link) - ^ Beven, Jack; Kelly, Larry (August 16, 2025). Hurricane Erin Tropical Cyclone Update (Report). Miami, Florida: National Hurricane Center. Retrieved 2025-08-16.
- ^ Berger, Eric (2025-08-16). "Rapidly intensifying Hurricane Erin becomes historic storm due to strengthening". Ars Technica. Retrieved 2025-08-16.
- ^ Masters, Jeff (May 29, 2025). "Tropical Storm Alvin forms off the Pacific coast of Mexico". New Haven, Connecticut: Yale climate connections. Retrieved May 31, 2025.
- ^ Oberholtz, Chris; Yablonski, Steve; Wulfeck, Andrew; Speck, Emilee (May 31, 2025). "Alvin downgraded as odds increase for new tropical development in Eastern Pacific". FOX Weather. Retrieved May 31, 2025.
- ^ Yablonski, Steven (2025-06-05). "Tropical Storm Barbara expected to become first hurricane of the season in Eastern Pacific". FOX Weather. Retrieved 2025-06-08.
- ^ Yablonski, Steven (2025-06-06). "Tropical Depression 3-E forms in Eastern Pacific and could become Tropical Storm Cosme later Sunday". FOX Weather. Retrieved 2025-06-08.
- ^ "Hurricane Barbara becomes first east Pacific hurricane of the season". NBC News. 2025-06-09. Retrieved 2025-06-09.
- ^ "Tropical Storm COSME". www.nhc.noaa.gov. Retrieved 2025-06-12.
- ^ "Barbara weakens to a tropical storm as it heads to cooler waters off the coast of Mexico". KOB.com. Associated Press. 2025-06-09. Retrieved 2025-06-12.
- ^ Oberholtz, Chris (2025-06-06). "Tropical Storm Cosme begins to weaken in Eastern Pacific, expected to become post-tropical". FOX Weather. Retrieved 2025-06-12.
- ^ Petro, Allison (2025-06-11). "NHC monitoring 2 areas for potential development in the eastern Pacific". WESH. Retrieved 2025-06-12.
- ^ "Post-Tropical Cyclone COSME". www.nhc.noaa.gov. Retrieved 2025-06-12.
- ^ "Potential Tropical Cyclone 4-E is developing in Eastern Pacific | Latest Weather Clips". Fox Weather. Retrieved 2025-06-12.
- ^ Speck, Emilee (2025-06-12). "Tropical Depression 4-E forms in Eastern Pacific; expected to become Tropical Storm Dalila soon". FOX Weather. Retrieved 2025-06-13.
- ^ "Tropical Storm Dalila forms in Eastern Pacific | Latest Weather Clips". Fox Weather. Retrieved 2025-06-13.
- ^ "Tropical Storm Wutip forms, to bring heavy rain from today – Taipei Times". www.taipeitimes.com. 2025-06-11. Retrieved 2025-06-12.
- ^ "LPA inside PAR becomes 'Auring', 1st tropical depression of 2025". GMA Network. 2025-06-12. Retrieved 2025-06-12.
- ^ Sabillo, Kristine (2025-06-17). "Typhoon Wutip ravages Asia with strong winds and flooding". Mongabay Environmental News. Retrieved 2025-06-19.
- ^ "First tropical cyclone of the season reported". ABC Pacific. 2025-01-12. Retrieved 2025-06-15.
- ^ Sabillo, Kristine (2025-04-22). "Cyclone Tam brings widespread flooding to New Zealand for days". Mongabay Environmental News. Retrieved 2025-06-15.
- ^ a b Longshore, David (2009). Encyclopedia of Hurricanes, Typhoons, and Cyclones, New Edition. Infobase Publishing. p. 333. ISBN 978-1-4381-1879-6.
- ^ a b Chang, C. P.; Erickson, J. E.; Lau, K. M. (1979). "Northeasterly Cold Surges and Near-Equatorial Disturbances over the Winter MONEX Area during December 1974. Part I: Synoptic Aspects". Monthly Weather Review. 107 (7). American Meteorological Society: 812–829. Bibcode:1979MWRv..107..812C. doi:10.1175/1520-0493(1979)107<0812:NCSANE>2.0.CO;2. Archived from the original on January 17, 2013. Retrieved February 14, 2025.
- ^ a b c d e "Australian Tropical Cyclone Database" (CSV). Bureau of Meteorology. 25 February 2025. Retrieved 25 February 2025.
- ^ "'Fragile' Mayotte still on high alert as storm moves away". Caledonian Record. AFP. 2025-01-12. Retrieved 2025-01-12.
- ^ "Tropical Cyclone Dikeledi Weakening, But Leaves Trail Of Destruction In Madagascar And Mozambique". Pindula. Retrieved 2025-01-23.
- ^ "Rainfall records tumble as Cyclone Sean intensifies". www.weatherzone.com.au. 2025-01-20. Retrieved 2025-01-20.
- ^ National Hurricane Center; Hurricane Research Division; Central Pacific Hurricane Center (April 26, 2024). "The Northeast and North Central Pacific hurricane database 1949–2023". United States National Oceanic and Atmospheric Administration's National Weather Service. Archived from the original on May 29, 2024. A guide on how to read the database is available here.
 This article incorporates text from this source, which is in the public domain.
- ^ Yoon, John (February 14, 2025). "Tropical Cyclone Zelia Makes Landfall in Northwest Australia". The New York Times. Archived from the original on February 15, 2025. Retrieved February 15, 2025.
- ^ "Southern Africa: Tropical Cyclone Jude Flash Update No. 1 (as of 11 March 2025) | OCHA". www.unocha.org. 2025-03-11. Retrieved 2025-05-14.
- ^ "Southern Africa: Tropical Storm Jude Flash Update No. 2 (as of 18 March 2025)". Relief Web. Archived from the original on 22 March 2025. Retrieved 18 March 2025.
- ^ "17 dead as Cyclone Jude wreaks havoc in East Africa". Mongabay. Archived from the original on 22 March 2025. Retrieved 17 March 2025.
- ^ a b Cite error: The named reference
aprwas invoked but never defined (see the help page). - ^ Cite error: The named reference
JMA BTwas invoked but never defined (see the help page). - ^ "Atlantic hurricane best track (HURDAT version 2)" (Database). United States National Hurricane Center. May 11, 2024. This article incorporates text from this source, which is in the public domain.
- Landsea, Chris (April 2022). "The revised Atlantic hurricane database (HURDAT2) - Chris Landsea – April 2022" (PDF). Hurricane Research Division – NOAA/AOML. Miami: Hurricane Research Division – via Atlantic Oceanographic and Meteorological Laboratory.
{{cite web}}: CS1 maint: ref duplicates default (link)
- Landsea, Chris (April 2022). "The revised Atlantic hurricane database (HURDAT2) - Chris Landsea – April 2022" (PDF). Hurricane Research Division – NOAA/AOML. Miami: Hurricane Research Division – via Atlantic Oceanographic and Meteorological Laboratory.
- ^ "Cyclone Tam: Easter holiday chaos – flights, ferries cancelled". NZ Herald. 2025-04-16. Retrieved 2025-04-16.
- ^ Dorst, Neal (June 2, 2016). "TCFAQ G1) When is hurricane season?". Atlantic Oceanographic and Meteorological Laboratory. Archived from the original on May 6, 2009. Retrieved July 27, 2022.
- ^ "Weekly Cat Report May 30, 2025" (PDF).
- ^ "India's Rising Tide of Climate Migration: A Crisis Without a Policy". The Hindu. 12 June 2025. Retrieved 12 June 2025.
- ^ "Lakhs still affected by floods in northeast; death toll reaches 55". PressReader. 7 June 2025. Retrieved 7 June 2025.
- ^ "Depression in Bay triggers coastal flooding, kills 3". Daily Sun. 31 May 2025. Retrieved 31 May 2025.
- ^ "Bangladesh: Floods and Landslides – Jun 2025". ReliefWeb. 2 June 2025. Retrieved 7 June 2025.
- ^ "ရေကြည်နှင့် ဒေးဒရဲတွင် လေပြင်းတိုက်ခတ်ပြီး လူနေအိမ် ၅၀ ခန့်ပျက်စီး". Democratic Voice of Burma (in Burmese). 31 May 2025. Retrieved 31 May 2025.
- ^ "NHC Graphical Outlook Archive". www.nhc.noaa.gov. Retrieved 2025-07-03.
- ^ Situational Report No. 4 for the Combined Effects of Southwest Monsoon and Low Pressure Area (LPA) (2025) (PDF) (Report). Quezon City, Philippines: National Disaster Risk Reduction and Management Council. June 13, 2025. Archived (PDF) from the original on June 14, 2025. Retrieved June 13, 2025.
- ^ "11 người chết do mưa lũ miền Trung" (in Vietnamese). VNExpress. 14 June 2025. Retrieved 14 June 2025.
- ^ "Typhoon Wutip triggers severe flooding in Vietnam, killing three and leaving four missing". Malay Mail. 2025-06-14. Retrieved 2025-06-14.
- ^ "Flooding in central Vietnam: 6 dead or missing as swollen rivers hit 30-year highs". VOV.VN. June 14, 2025. Retrieved June 14, 2025.
- ^ 中央通訊社 (2025-06-13). "逢甲大學老榕樹倒下 1學生送醫搶救不治 | 社會" [An old banyan tree fell down at Feng Chia University, and one student died after being sent to hospital]. 中央社 CNA (in Chinese). Retrieved 2025-06-13.
- ^ "Arévalo pide estar alertas por lluvias en Guatemala y paso de huracán". Prensa Latina (in Spanish). 18 June 2025. Retrieved 19 June 2025.
- ^ "Mưa lớn gây sạt lở đất ở Yên Bái, một nam sinh tử vong" [Heavy rain causes landslide in Yen Bai, one male student dies] (in Vietnamese). Tuổi Trẻ. 26 June 2025. Retrieved 27 June 2025.
- ^ https://modis.gsfc.nasa.gov/gallery/individual.php?db_date=2025-06-28
- ^ "Over 13,000 affected by Typhoon Danas, habagat". The Philippine Star. 6 July 2025. Retrieved 6 July 2025.
- ^ "Typhoon Danas leaves 2 dead, hundreds injured in Taiwan". NHK. 7 July 2025. Retrieved 7 July 2025.
- ^ "1 reported dead in Metro Manila due to Bising, Habagat —NDRRMC". GMA News. 10 July 2025. Retrieved 10 July 2025.
- ^ "Ilang parte ng Bicol binaha dahil sa habagat na pinalakas ng Bagyong Crising" [Some parts of Bicol flooded due to strong monsoon of Typhoon Crising] (in Tagalog). ABS-CBN. 17 July 2025. Retrieved 17 July 2025.
- ^ "Habagat, cyclone death toll hits 37: NDRRMC". ABS-CBN. 31 July 2025. Retrieved 31 July 2025.
- ^ Hung, Emily; Mycroft, Connor (20 July 2025). "Typhoon Wipha: Hong Kong emerges with dozens hurt, travellers frustrated". South China Morning Post.
- ^ "Developing: T10 signal to remain in force until 3pm in Hong Kong as Wipha starts to depart". South China Morning Post. 20 July 2025. Retrieved 20 July 2025.
- ^ "Tropical storm adds to Philippines' weather toll with 25 dead and 278,000 evacuated this week". ABC News. Retrieved 2025-07-31.
- ^ "Typhoon Co-May makes landfall in eastern China". www.aa.com.tr. Retrieved 2025-07-31.
- ^ "Shanghai evacuates 283,000 people as typhoon hits". France 24. 2025-07-30. Retrieved 2025-07-26.
- ^ Parker, Ansley (July 30, 2025). "Calm before the storm: August typically marks rise in hurricane activity | Here's what you need to know". www.13wmaz.com. WMAZ-TV. Retrieved August 4, 2025.
- ^ "1 missing, over 100 injured, 8,000 evacuated as Typhoon Podul batters Taiwan". Focus Taiwan. Retrieved 2025-08-13.
- ^ "楊柳颱風過境 高雄七旬翁修樓頂漏水墜樓亡". United Daily News (in Chinese). 2025-08-13. Retrieved 2025-08-14.
- ^ Jenn Jordan (August 12, 2025). "Tropical Storm Erin Kills 7 In Cabo Verde Islands As It Tracks Across Atlantic". The Weather Channel. Retrieved August 12, 2025.
- ^ Teo Blašković (August 12, 2025). "Nine killed as Tropical Storm Erin floods São Vicente, Cape Verde". The Watchers. Retrieved August 12, 2025.
- ^ Santos, Eduino dos (2025-08-13). "Cabo Verde/chuvas: Banco Mundial disponibiliza 10 milhões de dólares para resposta à tempestade tropical". Notícias do Norte (in European Portuguese). Retrieved 2025-08-16.
- ^ "Tropical Cyclone Heat Potential Seven Basins". NOAA. Retrieved 20 October 2021.
External links
| Tropical cyclone year articles (2020–present) |
|---|
| 2020, 2021, 2022, 2023, 2024, , Post-2025 |
Regional Specialized Meteorological Centers
- US National Hurricane Center. (RSMC Miami) – North Atlantic, Eastern Pacific
- Central Pacific Hurricane Center (RSMC Honolulu) – Central Pacific
- Japan Meteorological Agency (RSMC Tokyo) – West Pacific
- India Meteorological Department (RSMC New Delhi) – Bay of Bengal and the Arabian Sea
- Météo-France – La Reunion (RSMC La Réunion) – South-West Indian Ocean from 30°E to 90°E
- Fiji Meteorological Service (RSMC Nadi) – South Pacific, west of 160°E, north of 25° S
Tropical Cyclone Warning Centers
- Meteorology, Climatology, and Geophysical Agency of Indonesia (TCWC Jakarta) – South Indian Ocean from 90°E to 141°E, generally north of 10°S
- Australian Bureau of Meteorology (TCWC Melbourne), (Seven day forecast) – South Indian Ocean & South Pacific Ocean from 90°E to 160°E, generally south of 10°S
- Papua New Guinea National Weather Service (TCWC Port Moresby) – South Pacific Ocean from 141°E to 160°E, generally north of 10°S
- Meteorological Service of New Zealand Limited (TCWC Wellington) – South Pacific west of 160°E, south of 25°S
Other Warning Centres
- Philippine Atmospheric, Geophysical and Astronomical Services Administration – Monitors the West Pacific
- Brazilian Navy Hydrography Center - Marine Meteorological Service – Monitors the South Atlantic
- US Joint Typhoon Warning Centre – Monitors the East Pacific, Central Pacific, West Pacific, South Pacific, North Indian Ocean and South-West Indian Ocean