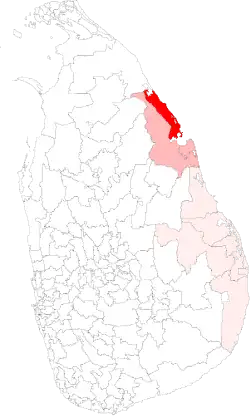
The Trincomalee Polling Division is a Polling Division in the Trincomalee Electoral District, in the Eastern Province, Sri Lanka.
Presidential Election Results
Summary
The winner of Trincomalee has matched the final country result 3 out of 8 times.
| Party
|
Trincomalee[4]
|
Trincomalee Electoral District
|
Sri Lanka
|
| Votes
|
%
|
Votes
|
%
|
Votes
|
%
|
|
|
NDF
|
|
56,594
|
78.02%
|
|
166,841
|
72.10%
|
|
5,564,239
|
41.99%
|
|
|
SLPP
|
|
12,818
|
17.67%
|
|
54,135
|
23.39%
|
|
6,924,255
|
52.25%
|
|
|
Other Parties (with < 1%)
|
|
3,125
|
4.31%
|
|
10,434
|
4.51%
|
|
764,005
|
5.76%
|
| Valid Votes
|
72,537
|
98.96%
|
231,410
|
99.21%
|
13,252,499
|
98.99%
|
| Rejected Votes
|
762
|
1.04%
|
1,832
|
0.79%
|
135,452
|
1.01%
|
| Total Polled
|
73,299
|
80.65%
|
233,242
|
82.97%
|
13,387,951
|
83.71%
|
| Registered Electors
|
90,881
|
|
281,114
|
|
15,992,568
|
|
| Party
|
Trincomalee[5]
|
Trincomalee Electoral District
|
Sri Lanka
|
| Votes
|
%
|
Votes
|
%
|
Votes
|
%
|
|
|
NDF
|
|
49,650
|
79.11%
|
|
140,338
|
71.84%
|
|
6,217,162
|
51.28%
|
|
|
UPFA
|
|
12,056
|
19.21%
|
|
52,111
|
26.67%
|
|
5,768,090
|
47.58%
|
|
|
Other Parties (with < 1%)
|
|
1,053
|
1.68%
|
|
2,907
|
1.49%
|
|
138,200
|
1.14%
|
| Valid Votes
|
62,759
|
98.72%
|
195,356
|
99.08%
|
12,123,452
|
98.85%
|
| Rejected Votes
|
816
|
1.28%
|
1,805
|
0.92%
|
140,925
|
1.15%
|
| Total Polled
|
63,575
|
73.09%
|
197,161
|
72.50%
|
12,264,377
|
78.69%
|
| Registered Electors
|
86,978
|
|
271,953
|
|
15,585,942
|
|
| Party
|
Trincomalee[6]
|
Trincomalee Electoral District
|
Sri Lanka
|
| Votes
|
%
|
Votes
|
%
|
Votes
|
%
|
|
|
NDF
|
|
35,887
|
69.42%
|
|
87,661
|
54.09%
|
|
4,173,185
|
40.15%
|
|
|
UPFA
|
|
13,935
|
26.95%
|
|
69,752
|
43.04%
|
|
6,015,934
|
57.88%
|
|
|
Other Parties (with < 1%)
|
|
1,876
|
3.63%
|
|
4,659
|
2.87%
|
|
204,494
|
1.97%
|
| Valid Votes
|
51,698
|
98.01%
|
162,072
|
98.52%
|
10,393,613
|
99.03%
|
| Rejected Votes
|
1,050
|
1.99%
|
2,432
|
1.48%
|
101,838
|
0.97%
|
| Total Polled
|
52,748
|
60.85%
|
164,504
|
34.10%
|
10,495,451
|
66.70%
|
| Registered Electors
|
86,685
|
|
482,356
|
|
15,734,587
|
|
| Party
|
Trincomalee[7]
|
Trincomalee Electoral District
|
Sri Lanka
|
| Votes
|
%
|
Votes
|
%
|
Votes
|
%
|
|
|
UNP
|
|
41,369
|
77.90%
|
|
92,197
|
61.33%
|
|
4,706,366
|
48.43%
|
|
|
UPFA
|
|
10,878
|
20.48%
|
|
55,680
|
37.04%
|
|
4,887,152
|
50.29%
|
|
|
Other Parties (with < 1%)
|
|
859
|
1.62%
|
|
2,457
|
1.63%
|
|
123,521
|
1.27%
|
| Valid Votes
|
53,106
|
98.23%
|
150,334
|
98.63%
|
9,717,039
|
98.88%
|
| Rejected Votes
|
956
|
1.77%
|
2,094
|
1.37%
|
109,869
|
1.12%
|
| Total Polled
|
54,062
|
59.35%
|
152,428
|
31.92%
|
9,826,908
|
69.51%
|
| Registered Electors
|
91,095
|
|
477,540
|
|
14,136,979
|
|
| Party
|
Trincomalee[8]
|
Trincomalee Electoral District
|
Sri Lanka
|
| Votes
|
%
|
Votes
|
%
|
Votes
|
%
|
|
|
UNP
|
|
28,061
|
64.13%
|
|
63,351
|
50.25%
|
|
3,602,748
|
42.71%
|
|
|
PA
|
|
13,807
|
31.56%
|
|
56,691
|
44.96%
|
|
4,312,157
|
51.12%
|
|
|
Other Parties (with < 1%)
|
|
1,313
|
3.00%
|
|
3,732
|
2.96%
|
|
176,679
|
2.09%
|
|
|
JVP
|
|
573
|
1.31%
|
|
2,307
|
1.83%
|
|
343,927
|
4.08%
|
| Valid Votes
|
43,754
|
97.27%
|
126,081
|
97.95%
|
8,435,754
|
97.69%
|
| Rejected Votes
|
1,227
|
2.73%
|
2,642
|
2.05%
|
199,536
|
2.31%
|
| Total Polled
|
44,981
|
58.05%
|
128,723
|
62.76%
|
8,635,290
|
72.17%
|
| Registered Electors
|
77,484
|
|
205,116
|
|
11,965,536
|
|
| Party
|
Trincomalee[9]
|
Trincomalee Electoral District
|
Sri Lanka
|
| Votes
|
%
|
Votes
|
%
|
Votes
|
%
|
|
|
PA
|
|
28,900
|
85.58%
|
|
77,943
|
71.62%
|
|
4,709,205
|
62.28%
|
|
|
UNP
|
|
3,925
|
11.62%
|
|
28,006
|
25.74%
|
|
2,715,283
|
35.91%
|
|
|
Ind 2
|
|
697
|
2.06%
|
|
2,074
|
1.91%
|
|
58,888
|
0.78%
|
|
|
Other Parties (with < 1%)
|
|
248
|
0.73%
|
|
798
|
0.73%
|
|
78,152
|
1.03%
|
| Valid Votes
|
33,770
|
98.41%
|
108,821
|
98.44%
|
7,561,526
|
98.03%
|
| Rejected Votes
|
545
|
1.59%
|
1,726
|
1.56%
|
151,706
|
1.97%
|
| Total Polled
|
34,315
|
50.83%
|
110,547
|
58.80%
|
7,713,232
|
69.12%
|
| Registered Electors
|
67,509
|
|
188,017
|
|
11,158,880
|
|
| Party
|
Trincomalee[10]
|
Trincomalee Electoral District
|
Sri Lanka
|
| Votes
|
%
|
Votes
|
%
|
Votes
|
%
|
|
|
SLMP
|
|
8,378
|
37.64%
|
|
14,103
|
17.49%
|
|
235,701
|
4.63%
|
|
|
UNP
|
|
8,112
|
36.45%
|
|
36,841
|
45.70%
|
|
2,569,199
|
50.43%
|
|
|
SLFP
|
|
5,767
|
25.91%
|
|
29,679
|
36.81%
|
|
2,289,857
|
44.95%
|
| Valid Votes
|
22,257
|
97.52%
|
80,620
|
98.38%
|
5,094,754
|
98.24%
|
| Rejected Votes
|
565
|
2.48%
|
1,326
|
1.62%
|
91,499
|
1.76%
|
| Total Polled
|
22,822
|
40.73%
|
81,949
|
53.72%
|
5,186,256
|
55.87%
|
| Registered Electors
|
56,026
|
|
152,540
|
|
9,283,143
|
|
| Party
|
Trincomalee[11]
|
Trincomalee Electoral District
|
Sri Lanka
|
| Votes
|
%
|
Votes
|
%
|
Votes
|
%
|
|
|
UNP
|
|
14,503
|
53.97%
|
|
45,522
|
48.64%
|
|
3,450,815
|
52.93%
|
|
|
SLFP
|
|
5,424
|
20.18%
|
|
31,700
|
33.87%
|
|
2,546,348
|
39.05%
|
|
|
ACTC
|
|
5,366
|
19.97%
|
|
10,068
|
10.76%
|
|
173,934
|
2.67%
|
|
|
JVP
|
|
1,305
|
4.86%
|
|
5,395
|
5.76%
|
|
273,428
|
4.19%
|
|
|
Other Parties (with < 1%)
|
|
274
|
1.02%
|
|
911
|
0.97%
|
|
75,526
|
1.16%
|
| Valid Votes
|
26,872
|
97.19%
|
93,596
|
98.12%
|
6,520,156
|
98.78%
|
| Rejected Votes
|
777
|
2.81%
|
1,795
|
1.88%
|
80,470
|
1.22%
|
| Total Polled
|
27,649
|
56.15%
|
95,391
|
70.69%
|
6,600,626
|
80.15%
|
| Registered Electors
|
49,244
|
|
134,948
|
|
8,235,358
|
|
Parliamentary Election Results
Summary
The winner of Trincomalee has matched the final country result 0 out of 7 times.
| Party
|
Trincomalee[14]
|
Trincomalee Electoral District
|
Sri Lanka
|
| Votes
|
%
|
Votes
|
%
|
Votes
|
%
|
|
|
ITAK
|
|
27,612
|
48.72%
|
|
45,894
|
25.49%
|
|
515,963
|
4.63%
|
|
|
UNP
|
|
17,674
|
31.18%
|
|
83,638
|
46.45%
|
|
5,098,916
|
45.77%
|
|
|
UPFA
|
|
8,211
|
14.49%
|
|
38,463
|
21.36%
|
|
4,732,664
|
42.48%
|
|
|
IG0
|
|
913
|
1.61%
|
|
6,520
|
3.62%
|
|
14,927
|
0.13%
|
|
|
Other Parties (with < 1%)
|
|
885
|
1.56%
|
|
1,850
|
1.03%
|
|
83,525
|
0.75%
|
|
|
AITC
|
|
783
|
1.38%
|
|
1,144
|
0.64%
|
|
18,644
|
0.17%
|
|
|
JVP
|
|
599
|
1.06%
|
|
2,556
|
1.42%
|
|
544,154
|
4.88%
|
| Valid Votes
|
56,677
|
93.73%
|
180,065
|
94.31%
|
11,140,333
|
95.35%
|
| Rejected Votes
|
3,755
|
6.21%
|
10,542
|
5.52%
|
516,926
|
4.42%
|
| Total Polled
|
60,469
|
69.52%
|
190,938
|
74.34%
|
11,684,111
|
77.66%
|
| Registered Electors
|
86,978
|
|
256,852
|
|
15,044,490
|
|
| Party
|
Trincomalee[15]
|
Trincomalee Electoral District
|
Sri Lanka
|
| Votes
|
%
|
Votes
|
%
|
Votes
|
%
|
|
|
ITAK
|
|
20,578
|
47.41%
|
|
33,268
|
23.85%
|
|
233,190
|
2.91%
|
|
|
UPFA
|
|
10,961
|
25.25%
|
|
59,784
|
42.85%
|
|
4,846,388
|
60.38%
|
|
|
UNP
|
|
8,718
|
20.09%
|
|
39,691
|
28.45%
|
|
2,357,057
|
29.37%
|
|
|
TMVP
|
|
1,106
|
2.55%
|
|
1,712
|
1.23%
|
|
20,284
|
0.25%
|
|
|
AITC
|
|
956
|
2.20%
|
|
1,182
|
0.85%
|
|
7,544
|
0.09%
|
|
|
Other Parties (with < 1%)
|
|
561
|
1.29%
|
|
1,357
|
0.97%
|
|
33,457
|
0.42%
|
|
|
DNA
|
|
522
|
1.20%
|
|
2,519
|
1.81%
|
|
441,251
|
5.50%
|
| Valid Votes
|
43,402
|
92.47%
|
139,513
|
93.02%
|
8,026,322
|
96.03%
|
| Rejected Votes
|
3,483
|
7.42%
|
10,240
|
6.83%
|
581,465
|
6.96%
|
| Total Polled
|
46,937
|
54.15%
|
149,982
|
59.19%
|
8,358,246
|
59.29%
|
| Registered Electors
|
86,685
|
|
253,399
|
|
14,097,690
|
|
| Party
|
Trincomalee[16]
|
Trincomalee Electoral District
|
Sri Lanka
|
| Votes
|
%
|
Votes
|
%
|
Votes
|
%
|
|
|
ITAK
|
|
43,880
|
65.16%
|
|
69,087
|
37.77%
|
|
633,203
|
6.85%
|
|
|
SLMC
|
|
13,378
|
19.86%
|
|
65,191
|
35.64%
|
|
186,880
|
2.02%
|
|
|
UPFA
|
|
6,229
|
9.25%
|
|
31,053
|
16.98%
|
|
4,223,126
|
45.70%
|
|
|
UNP
|
|
3,193
|
4.74%
|
|
15,693
|
8.58%
|
|
3,486,792
|
37.73%
|
|
|
Other Parties (with < 1%)
|
|
667
|
0.99%
|
|
1,906
|
1.04%
|
|
601,931
|
6.51%
|
| Valid Votes
|
67,347
|
95.64%
|
182,930
|
95.38%
|
9,241,931
|
94.52%
|
| Rejected Votes
|
3,073
|
4.36%
|
8,863
|
4.62%
|
534,452
|
5.47%
|
| Total Polled
|
70,420
|
81.62%
|
191,793
|
85.33%
|
9,777,821
|
75.74%
|
| Registered Electors
|
86,277
|
|
224,764
|
|
12,909,631
|
|
| Party
|
Trincomalee[17]
|
Trincomalee Electoral District
|
Sri Lanka
|
| Votes
|
%
|
Votes
|
%
|
Votes
|
%
|
|
|
TULF
|
|
35,639
|
60.93%
|
|
56,121
|
34.83%
|
|
348,164
|
3.89%
|
|
|
UNP
|
|
14,560
|
24.89%
|
|
62,930
|
39.05%
|
|
4,086,026
|
45.62%
|
|
|
PA
|
|
5,027
|
8.59%
|
|
32,997
|
20.48%
|
|
3,330,815
|
37.19%
|
|
|
JVP
|
|
1,664
|
2.84%
|
|
6,095
|
3.78%
|
|
815,353
|
9.10%
|
|
|
EPDP
|
|
1,209
|
2.07%
|
|
1,470
|
0.91%
|
|
72,783
|
0.81%
|
|
|
Other Parties (with < 1%)
|
|
396
|
0.68%
|
|
1,525
|
0.95%
|
|
128,199
|
1.43%
|
| Valid Votes
|
58,495
|
94.73%
|
161,138
|
95.03%
|
8,955,844
|
94.77%
|
| Rejected Votes
|
3,251
|
5.27%
|
8,429
|
4.97%
|
494,009
|
5.23%
|
| Total Polled
|
61,746
|
75.83%
|
169,567
|
79.88%
|
9,449,878
|
76.03%
|
| Registered Electors
|
81,422
|
|
212,280
|
|
12,428,762
|
|
| Party
|
Trincomalee[18]
|
Trincomalee Electoral District
|
Sri Lanka
|
| Votes
|
%
|
Votes
|
%
|
Votes
|
%
|
|
|
UNP
|
|
12,861
|
26.75%
|
|
46,676
|
35.08%
|
|
3,451,765
|
40.12%
|
|
|
PA
|
|
11,928
|
24.81%
|
|
53,802
|
40.44%
|
|
3,899,329
|
45.33%
|
|
|
TULF
|
|
11,070
|
23.02%
|
|
14,088
|
10.59%
|
|
105,907
|
1.23%
|
|
|
EPDP
|
|
3,382
|
7.03%
|
|
4,524
|
3.40%
|
|
50,702
|
0.59%
|
|
|
ACTC
|
|
3,269
|
6.80%
|
|
3,748
|
2.82%
|
|
27,289
|
0.32%
|
|
|
IG2
|
|
2,268
|
4.72%
|
|
2,621
|
1.97%
|
|
31,443
|
0.37%
|
|
|
Other Parties (with < 1%)
|
|
1,208
|
2.51%
|
|
1,979
|
1.49%
|
|
216,732
|
2.52%
|
|
|
JVP
|
|
901
|
1.87%
|
|
3,293
|
2.48%
|
|
518,725
|
6.03%
|
|
|
IG3
|
|
674
|
1.40%
|
|
1,434
|
1.08%
|
|
6,109
|
0.07%
|
|
|
IG6
|
|
526
|
1.09%
|
|
872
|
0.66%
|
|
3,162
|
0.04%
|
| Valid Votes
|
48,087
|
N/A
|
133,037
|
N/A
|
8,602,617
|
N/A
|
| Party
|
Trincomalee[19]
|
Trincomalee Electoral District
|
Sri Lanka
|
| Votes
|
%
|
Votes
|
%
|
Votes
|
%
|
|
|
TULF
|
|
18,548
|
47.79%
|
|
28,380
|
23.66%
|
|
132,461
|
1.67%
|
|
|
SLMC
|
|
5,710
|
14.71%
|
|
26,903
|
22.43%
|
|
143,307
|
1.80%
|
|
|
UNP
|
|
5,703
|
14.69%
|
|
34,986
|
29.17%
|
|
3,498,370
|
44.04%
|
|
|
PA
|
|
5,156
|
13.28%
|
|
23,886
|
19.91%
|
|
3,887,805
|
48.94%
|
|
|
TELO
|
|
2,736
|
7.05%
|
|
3,709
|
3.09%
|
|
24,974
|
0.31%
|
|
|
Other Parties (with < 1%)
|
|
551
|
1.42%
|
|
1,197
|
1.00%
|
|
138,277
|
1.74%
|
|
|
EPRLF
|
|
408
|
1.05%
|
|
881
|
0.73%
|
|
9,411
|
0.12%
|
| Valid Votes
|
38,812
|
94.84%
|
119,942
|
94.72%
|
7,943,688
|
95.20%
|
| Rejected Votes
|
2,110
|
5.16%
|
6,682
|
5.28%
|
400,395
|
4.80%
|
| Total Polled
|
40,922
|
60.62%
|
126,624
|
67.36%
|
8,344,095
|
74.75%
|
| Registered Electors
|
67,509
|
|
187,991
|
|
11,163,064
|
|
| Party
|
Trincomalee[20]
|
Trincomalee Electoral District
|
Sri Lanka
|
| Votes
|
%
|
Votes
|
%
|
Votes
|
%
|
|
|
INDI
|
|
15,915
|
46.30%
|
|
25,239
|
24.85%
|
|
175,579
|
3.14%
|
|
|
TULF
|
|
7,325
|
21.31%
|
|
12,755
|
12.56%
|
|
188,594
|
3.37%
|
|
|
SLMC
|
|
5,164
|
15.02%
|
|
17,884
|
17.61%
|
|
202,016
|
3.61%
|
|
|
SLFP
|
|
2,950
|
8.58%
|
|
22,966
|
22.61%
|
|
1,785,369
|
31.90%
|
|
|
UNP
|
|
2,881
|
8.38%
|
|
22,450
|
22.10%
|
|
2,838,005
|
50.71%
|
|
|
Other Parties (with < 1%)
|
|
141
|
0.41%
|
|
284
|
0.28%
|
|
90,480
|
1.62%
|
| Valid Votes
|
34,376
|
96.36%
|
101,578
|
95.42%
|
5,596,468
|
93.87%
|
| Rejected Votes
|
1,299
|
3.64%
|
4,878
|
4.58%
|
365,563
|
6.13%
|
| Total Polled
|
35,675
|
64.59%
|
106,456
|
69.90%
|
5,962,031
|
63.60%
|
| Registered Electors
|
55,236
|
|
152,289
|
|
9,374,164
|
|
Demographics
Ethnicity
The Trincomalee Polling Division has a Sri Lankan Tamil majority (54.9%), a significant Moor population (26.3%) and a significant Sinhalese population (17.2%) . In comparison, the Trincomalee Electoral District (which contains the Trincomalee Polling Division) has a Moor plurality (41.8%), a significant Sri Lankan Tamil population (30.7%) and a significant Sinhalese population (26.7%) [1]
Religion
The Trincomalee Polling Division has a Hindu plurality (43.6%), a significant Muslim population (26.6%) and a significant Buddhist population (16.1%) . In comparison, the Trincomalee Electoral District (which contains the Trincomalee Polling Division) has a Muslim plurality (42.0%), a significant Buddhist population (26.2%) and a significant Hindu population (25.9%) [1]
References