Panukulan
Panukulan | |
|---|---|
| Municipality of Panukulan | |
 Flag  Seal | |
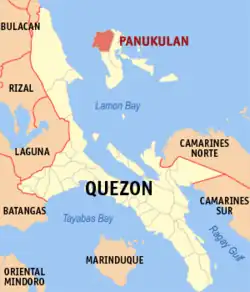 Location of Panukulan in Quezon | |
OpenStreetMap | |
.svg.png) Panukulan Location within the Philippines | |
| Coordinates: 14°56′N 121°49′E / 14.93°N 121.82°E | |
| Country | Philippines |
| Region | Calabarzon |
| Province | Quezon |
| District | 1st district |
| Founded | June 21, 1959 |
| Barangays | 13 (see Barangays) |
| Government | |
| • Type | Sangguniang Bayan |
| • Mayor | Alfred Rigor S. Mitra |
| • Vice Mayor | Herminio A. Peñamante |
| • Representative | Wilfrido Mark M. Enverga |
| • Municipal Council | Members |
| • Electorate | 11,952 voters (2025) |
| Area | |
• Total | 226.61 km2 (87.49 sq mi) |
| Elevation | 9.0 m (29.5 ft) |
| Highest elevation | 165 m (541 ft) |
| Lowest elevation | 0 m (0 ft) |
| Population (2024 census)[3] | |
• Total | 17,118 |
| • Density | 76/km2 (200/sq mi) |
| • Households | 3,867 |
| Demonym(s) | Panukulanin, Panukuleño |
| Economy | |
| • Income class | 4th municipal income class |
| • Poverty incidence | 26.03 |
| • Revenue | ₱ 49.26 million (2022) |
| • Assets | ₱ 290.3 million (2022) |
| • Expenditure | ₱ 164.6 million (2022) |
| • Liabilities | ₱ 44.09 million (2022) |
| Service provider | |
| • Electricity | Quezon 2 Electric Cooperative (QUEZELCO 2) |
| Time zone | UTC+8 (PST) |
| ZIP code | 4337 |
| PSGC | |
| IDD : area code | +63 (0)42 |
| Native languages | Tagalog |
| Website | www |
Panukulan, officially the Municipality of Panukulan (Tagalog: Bayan ng Panukulan), is a municipality in the province of Quezon, Philippines. According to the 2020 census, it has a population of 16,376 people.[5]
History
Panukulan was established as a municipal district when barangays Panukulan, Calasumanga, Libo, and Lipata separated from the municipality of Polillo by virtue of Republic Act No. 2452 enacted on June 21, 1959.[6]
Geography
Panukulan is located in the northwestern part of the island of Polillo in the Polillo Islands which is 26 nautical miles from Infanta, Quezon. It is geographically situated at 121°48.50′ longitude and 14°56′ latitude. It is bounded in the north by the Philippine Sea (Pacific Ocean), on the east by the municipality of Burdeos, Quezon, on the south by Polillo, Quezon, and on the west by Polillo Strait. Infanta, Quezon is its nearest commercial center. Its travel time by motor boat going to Infanta and vice- versa is about 1.5 hours to 2 hours, depending on the weather condition.
Only a single regular trip is available, which leaves the Municipal Port at 7:30 AM PHT and return from Infanta at 2:00 PM. All barangays are accessible through banca or motorboat. Only Barangay Balungay up to the boundary of Barangay Pag-itan can be reached through land transportation. However, there are also Tricycle Operators at Barangay Libo to Kinalagti, Barangay Libo to Pandan, and Barangay Calasumanga, which is now connected with the municipality of Polillo through tricycle.[7]
Barangays
Panukulan is politically subdivided into 13 barangays, as indicated below. Each barangay consists of puroks and some have sitios.
- Balungay
- Bato
- Bonbon
- Calasumanga
- Kinalagti
- Libo
- Lipata
- Matangkap
- Milawid
- Pagitan
- Pandan
- Rizal
- San Juan (Poblacion)
Climate
| Climate data for Panukulan, Quezon | |||||||||||||
|---|---|---|---|---|---|---|---|---|---|---|---|---|---|
| Month | Jan | Feb | Mar | Apr | May | Jun | Jul | Aug | Sep | Oct | Nov | Dec | Year |
| Mean daily maximum °C (°F) | 26 (79) |
27 (81) |
28 (82) |
30 (86) |
31 (88) |
30 (86) |
20 (68) |
30 (86) |
29 (84) |
29 (84) |
28 (82) |
27 (81) |
28 (82) |
| Mean daily minimum °C (°F) | 21 (70) |
21 (70) |
22 (72) |
23 (73) |
24 (75) |
25 (77) |
24 (75) |
24 (75) |
24 (75) |
23 (73) |
23 (73) |
22 (72) |
23 (73) |
| Average precipitation mm (inches) | 33 (1.3) |
26 (1.0) |
26 (1.0) |
30 (1.2) |
109 (4.3) |
165 (6.5) |
187 (7.4) |
163 (6.4) |
162 (6.4) |
147 (5.8) |
85 (3.3) |
74 (2.9) |
1,207 (47.5) |
| Average rainy days | 10.2 | 7.6 | 9.6 | 10.5 | 19.9 | 23.6 | 26.0 | 24.8 | 24.5 | 19.6 | 12.7 | 13.0 | 202 |
| Source: Meteoblue[8] | |||||||||||||
Demographics
| Year | Pop. | ±% p.a. |
|---|---|---|
| 1960 | 2,704 | — |
| 1970 | 6,092 | +8.45% |
| 1975 | 7,657 | +4.69% |
| 1980 | 7,885 | +0.59% |
| 1990 | 9,815 | +2.21% |
| 1995 | 10,351 | +1.00% |
| 2000 | 11,311 | +1.92% |
| 2007 | 11,968 | +0.78% |
| 2010 | 12,511 | +1.63% |
| 2015 | 13,546 | +1.53% |
| 2020 | 16,376 | +4.07% |
| 2024 | 17,118 | +1.07% |
| Source: Philippine Statistics Authority[9][10][11][12][13] | ||
Economy
Poverty incidence of Panukulan
10
20
30
40
50
60
2000
56.12 2003
41.55 2006
54.90 2009
34.46 2012
42.40 2015
39.45 2018
22.30 2021
26.03 Source: Philippine Statistics Authority[14][15][16][17][18][19][20][21] |
Government
See also
References
- ^ Municipality of Panukulan | (DILG)
- ^ "2015 Census of Population, Report No. 3 – Population, Land Area, and Population Density" (PDF). Philippine Statistics Authority. Quezon City, Philippines. August 2016. ISSN 0117-1453. Archived (PDF) from the original on May 25, 2021. Retrieved July 16, 2021.
- ^ "2024 Census of Population (POPCEN) Population Counts Declared Official by the President". Philippine Statistics Authority. 17 July 2025. Retrieved 18 July 2025.
- ^ "PSA Releases the 2021 City and Municipal Level Poverty Estimates". Philippine Statistics Authority. 2 April 2024. Retrieved 28 April 2024.
- ^ "2024 Census of Population (POPCEN) Population Counts Declared Official by the President". Philippine Statistics Authority. 17 July 2025. Retrieved 18 July 2025.
- ^ Republic Act No. 2452 (June 21, 1959), An Act Creating Municipal Districts in the Province of Quezon, retrieved August 16, 2025
- ^ "Panukulan". DILG.
- ^ "Panukulan: Average Temperatures and Rainfall". Meteoblue. Retrieved 27 January 2020.
- ^ "2024 Census of Population (POPCEN) Population Counts Declared Official by the President". Philippine Statistics Authority. 17 July 2025. Retrieved 18 July 2025.
- ^ Census of Population (2015). "Region IV-A (Calabarzon)". Total Population by Province, City, Municipality and Barangay. Philippine Statistics Authority. Retrieved 20 June 2016.
- ^ Census of Population and Housing (2010). "Region IV-A (Calabarzon)" (PDF). Total Population by Province, City, Municipality and Barangay. National Statistics Office. Retrieved 29 June 2016.
- ^ Censuses of Population (1903–2007). "Region IV-A (Calabarzon)". Table 1. Population Enumerated in Various Censuses by Province/Highly Urbanized City: 1903 to 2007. National Statistics Office.
- ^ "Province of". Municipality Population Data. Local Water Utilities Administration Research Division. Retrieved 17 December 2016.
- ^ "Poverty incidence (PI):". Philippine Statistics Authority. Retrieved December 28, 2020.
- ^ "Estimation of Local Poverty in the Philippines" (PDF). Philippine Statistics Authority. 29 November 2005.
- ^ "2003 City and Municipal Level Poverty Estimates" (PDF). Philippine Statistics Authority. 23 March 2009.
- ^ "City and Municipal Level Poverty Estimates; 2006 and 2009" (PDF). Philippine Statistics Authority. 3 August 2012.
- ^ "2012 Municipal and City Level Poverty Estimates" (PDF). Philippine Statistics Authority. 31 May 2016.
- ^ "Municipal and City Level Small Area Poverty Estimates; 2009, 2012 and 2015". Philippine Statistics Authority. 10 July 2019.
- ^ "PSA Releases the 2018 Municipal and City Level Poverty Estimates". Philippine Statistics Authority. 15 December 2021. Retrieved 22 January 2022.
- ^ "PSA Releases the 2021 City and Municipal Level Poverty Estimates". Philippine Statistics Authority. 2 April 2024. Retrieved 28 April 2024.
External links
- Panukulan Profile at PhilAtlas.com
- https://web.archive.org/web/20120701062625/http://www.quezon.gov.ph/about/panukulan.html
- Philippine Standard Geographic Code
- Philippine Census Information
- Local Governance Performance Management System Archived 2016-03-04 at the Wayback Machine
- www.chanrobles.com
Places adjacent to Panukulan | ||||||||||||||||
|---|---|---|---|---|---|---|---|---|---|---|---|---|---|---|---|---|
| ||||||||||||||||
Lucena (capital and largest city) | |
| Municipalities |
|
| Component city | |
| Highly urbanized city |
|