List of U.S. states and territories by GDP


This is a list of U.S. states and territories by gross domestic product (GDP). This article presents the 50 U.S. states and the District of Columbia and their nominal GDP at current prices.
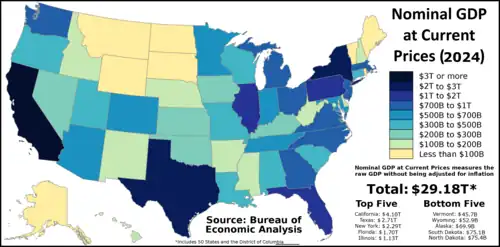
The data source for the list is the Bureau of Economic Analysis (BEA) in 2024. The BEA defined GDP by state as "the sum of value added from all industries in the state."[1]
Overall, in the calendar year 2024, the United States' Nominal GDP at Current Prices totaled at $29.184 trillion, as compared to $27.720 trillion in 2023.
The three U.S. states with the highest GDPs were California ($4.103 trillion), Texas ($2.709 trillion), and New York ($2.297 trillion). The three U.S. states with the lowest GDPs were Vermont ($45.7 billion), Wyoming ($53.0 billion), and Alaska ($69.9 billion).
GDP per capita also varied widely throughout the United States in 2024, with New York ($117,332), Massachusetts ($110,561), and Washington (state) ($108,468) recording the three highest GDP per capita figures in the U.S., while Mississippi ($53,061), Arkansas ($60,276), and West Virginia ($60,783) recorded the three lowest GDP per capita figures in the U.S. The District of Columbia, though, recorded a GDP per capita figure far higher than any U.S. state in 2024 at $263,220.
50 states and Washington, D.C.
The following list includes the annual nominal gross domestic product for each of the 50 U.S. states and the national capital of Washington, D.C. and the GDP change and GDP per capita as of 2024.[1][2]
The total for the United States in this table excludes U.S. territories. The raw GDP data below is measured in millions of U.S. dollars.
| State or federal district | Nominal GDP at current prices 2024 (millions of U.S. dollars)[1]
|
Annual GDP change at current prices (2023–2024)[1]
|
% of national[1] | ||||||
|---|---|---|---|---|---|---|---|---|---|
| 2023 | 2024 | 2023 | 2024 | 2023 | 2024 | ||||
| 3,870,379 | 4,103,124 | $100,038 | $104,916 | 14.11% | 14.14% | ||||
| 2,583,866 | 2,709,393 | $85,110 | $86,987 | 9.37% | 9.34% | ||||
| 2,172,010 | 2,297,028 | $110,781 | $117,332 | 7.86% | 7.92% | ||||
| 1,600,811 | 1,705,565 | $70,557 | $73,784 | 5.77% | 5.87% | ||||
| 1,098,346 | 1,137,244 | $87,033 | $90,449 | 3.96% | 3.92% | ||||
| 976,361 | 1,024,206 | $75,189 | $78,544 | 3.53% | 3.52% | ||||
| 884,834 | 927,740 | $74,739 | $78,120 | 3.19% | 3.20% | ||||
| 831,828 | 882,535 | $73,558 | $78,754 | 2.94% | 3.04% | ||||
| 807,865 | 854,683 | $103,462 | $108,468 | 2.93% | 2.95% | ||||
| 806,665 | 846,587 | $86,847 | $90,272 | 2.92% | 2.92% | ||||
| 788,103 | 839,122 | $71,373 | $75,876 | 2.80% | 2.89% | ||||
| 736,296 | 780,666 | $105,884 | $110,561 | 2.68% | 2.69% | ||||
| 719,897 | 764,475 | $81,794 | $86,747 | 2.59% | 2.63% | ||||
| 673,818 | 719,392 | $66,198 | $71,083 | 2.41% | 2.44% | ||||
| 529,627 | 553,323 | $89,469 | $93,026 | 1.90% | 1.91% | ||||
| 522,767 | 552,167 | $68,965 | $73,203 | 1.86% | 1.90% | ||||
| 523,032 | 549,709 | $74,081 | $75,748 | 1.91% | 1.89% | ||||
| 515,607 | 542,766 | $83,565 | $87,021 | 1.87% | 1.87% | ||||
| 499,503 | 527,381 | $73,047 | $76,004 | 1.82% | 1.82% | ||||
| 483,162 | 500,851 | $82,885 | $86,371 | 1.72% | 1.72% | ||||
| 428,447 | 451,285 | $70,569 | $75,605 | 1.51% | 1.55% | ||||
| 430,114 | 451,201 | $68,623 | $72,108 | 1.54% | 1.55% | ||||
| 345,912 | 365,723 | $94,876 | $100,235 | 1.24% | 1.26% | ||||
| 327,420 | 349,965 | $60,550 | $63,711 | 1.18% | 1.21% | ||||
| 318,884 | 331,029 | $75,477 | $77,916 | 1.15% | 1.14% | ||||
| 314,989 | 327,782 | $68,507 | $71,642 | 1.13% | 1.13% | ||||
| 304,936 | 321,238 | $59,174 | $61,846 | 1.10% | 1.10% | ||||
| 281,329 | 300,904 | $80,476 | $86,506 | 0.99% | 1.04% | ||||
| 279,707 | 293,021 | $61,961 | $64,110 | 1.01% | 1.01% | ||||
| 256,689 | 265,779 | $63,390 | $64,719 | 0.93% | 0.92% | ||||
| 245,979 | 260,728 | $75,585 | $80,880 | 0.87% | 0.90% | ||||
| 254,032 | 257,021 | $78,209 | $79,631 | 0.91% | 0.89% | ||||
| 228,232 | 234,673 | $78,348 | $79,513 | 0.83% | 0.81% | ||||
| 178,606 | 188,723 | $57,657 | $60,276 | 0.64% | 0.65% | ||||
| 181,285 | 185,411 | $91,553 | $93,145 | 0.65% | 0.64% | ||||
| 176,502 | 184,916 | $259,938 | $263,220 | 0.64% | 0.64% | ||||
| 151,147 | 157,491 | $49,911 | $53,061 | 0.54% | 0.54% | ||||
| 135,010 | 140,542 | $62,209 | $66,229 | 0.47% | 0.49% | ||||
| 120,958 | 128,132 | $60,980 | $63,991 | 0.43% | 0.44% | ||||
| 114,101 | 121,189 | $79,929 | $85,518 | 0.41% | 0.42% | ||||
| 110,265 | 115,627 | $75,946 | $80,325 | 0.40% | 0.40% | ||||
| 102,152 | 107,660 | $56,630 | $60,783 | 0.36% | 0.37% | ||||
| 98,069 | 103,253 | $91,207 | $98,055 | 0.34% | 0.35% | ||||
| 93,270 | 98,606 | $65,785 | $69,803 | 0.33% | 0.34% | ||||
| 77,574 | 82,493 | $71,122 | $74,594 | 0.28% | 0.28% | ||||
| 73,255 | 75,999 | $62,753 | $66,379 | 0.26% | 0.26% | ||||
| 76,043 | 75,399 | $95,082 | $95,982 | 0.27% | 0.26% | ||||
| 74,034 | 75,179 | $79,412 | $80,685 | 0.26% | 0.26% | ||||
| 68,056 | 69,969 | $92,272 | $95,147 | 0.25% | 0.24% | ||||
| 51,991 | 52,946 | $86,880 | $90,335 | 0.18% | 0.18% | ||||
| 43,534 | 45,707 | $67,006 | $70,131 | 0.16% | 0.16% | ||||
| 27,720,709 | 29,184,890 | $82,250 | $85,810 | 100% | 100% | ||||
U.S. territories
The Bureau of Economic Analysis (BEA) collects GDP data for five U.S. territories (American Samoa, Guam, the Northern Mariana Islands, Puerto Rico, and the U.S. Virgin Islands) separately from the states and the District of Columbia. Data for the U.S. territories is from the World Bank for GDP, GDP per capita and the real growth.[3][4][5][6][7][8]
| Territory | Nominal GDP at current prices (millions of U.S. dollars) |
Real GDP growth rate | GDP per capita | Year of reference |
|---|---|---|---|---|
| $115,799 | $37,170 | 2023 | ||
| $6,910 | $40,807 | 2022 | ||
| $4,672 | $44,320 | 2022 | ||
| $1,096 | $22,118 | 2022 | ||
| $871 | $19,673 | 2022 | ||
| Minor Outlying Islands | ||||
| Total | $129,348 | $32,818 | 2022–2023 |
US states by GDP if they were sovereign states
An orange background indicates a US state or District of Columbia.
| Rank | US state or country | GDP (millions of US dollars) |
|---|---|---|
| 1 | China | 18,743,803 |
| 2 | Germany | 4,659,929 |
| 3 | California | 4,103,124 |
| 4 | Japan | 4,026,211 |
| 5 | India | 3,912,686 |
| 6 | United Kingdom | 3,643,834 |
| 7 | France | 3,162,079 |
| 8 | Texas | 2,709,393 |
| 9 | Italy | 2,372,775 |
| 10 | New York | 2,297,028 |
| 11 | Canada | 2,241,253 |
| 12 | Brazil | 2,179,412 |
| 13 | Russia | 2,173,836 |
| 14 | Mexico | 1,852,723 |
| 15 | Australia | 1,752,193 |
| 16 | Spain | 1,722,746 |
| 17 | South Korea | 1,712,793 |
| 18 | Florida | 1,705,565 |
| 19 | Indonesia | 1,396,300 |
| 20 | Turkey | 1,323,255 |
| 21 | Saudi Arabia | 1,237,530 |
| 22 | Netherlands | 1,227,544 |
| 23 | Illinois | 1,137,244 |
| 24 | Pennsylvania | 1,024,206 |
| 25 | Switzerland | 936,564 |
| 26 | Ohio | 927,740 |
| 27 | Poland | 914,696 |
| 28 | Georgia (U.S. state) | 882,535 |
| 29 | Washington | 854,683 |
| 30 | New Jersey | 846,587 |
| 31 | North Carolina | 839,122 |
| 32 | Massachusetts | 780,666 |
| 33 | Virginia | 764,475 |
| 34 | Michigan | 719,392 |
| 35 | Belgium | 664,564 |
| 36 | Argentina | 633,267 |
| 37 | Sweden | 610,118 |
| 38 | Ireland | 577,389 |
| 39 | Colorado | 553,323 |
| 40 | Arizona | 552,167 |
| 41 | Tennessee | 549,709 |
| 42 | Singapore | 547,387 |
| 43 | Maryland | 542,766 |
| 44 | Israel | 540,380 |
| 45 | United Arab Emirates | 537,079 |
| 46 | Indiana | 527,381 |
| 47 | Thailand | 526,411 |
| 48 | Austria | 521,642 |
| 49 | Minnesota | 500,851 |
| 50 | Norway | 483,727 |
| 51 | Vietnam | 476,388 |
| 52 | Philippines | 461,618 |
| 53 | Wisconsin | 451,285 |
| 54 | Missouri | 451,201 |
| 55 | Bangladesh | 450,119 |
| 56 | Iran | 436,906 |
| 57 | Denmark | 429,457 |
| 58 | Malaysia | 421,972 |
| 59 | Colombia | 418,542 |
| 60 | Hong Kong | 407,107 |
| 61 | South Africa | 400,261 |
| 62 | Egypt | 389,050 |
| 63 | Romania | 382,768 |
| 64 | Pakistan | 373,072 |
| 65 | Connecticut | 365,723 |
| 66 | South Carolina | 349,965 |
| 67 | Czech Republic | 345,037 |
| 68 | Oregon | 331,029 |
| 69 | Chile | 330,267 |
| 70 | Louisiana | 327,782 |
| 71 | Alabama | 321,238 |
| 72 | Portugal | 308,683 |
| 73 | Utah | 300,904 |
| 74 | Finland | 299,836 |
| 75 | Kentucky | 293,021 |
| 76 | Peru | 289,222 |
| 77 | Kazakhstan | 288,406 |
| 78 | Iraq | 279,641 |
| 79 | Oklahoma | 265,779 |
| 80 | Algeria | 263,620 |
| 81 | Nevada | 260,728 |
| 82 | New Zealand | 260,236 |
| 83 | Greece | 257,145 |
| 84 | Iowa | 257,021 |
| 85 | Kansas | 234,673 |
| 86 | Hungary | 222,905 |
| 87 | Qatar | 217,983 |
| 88 | Ukraine | 190,741 |
| 89 | Arkansas | 188,723 |
| 90 | Nigeria | 187,760 |
| 91 | Nebraska | 185,411 |
| 92 | District of Columbia | 184,916 |
| 93 | Ethiopia | 163,698 |
| 94 | Kuwait | 160,227 |
| 95 | Mississippi | 157,491 |
| 96 | Morocco | 154,431 |
| 97 | Slovakia | 141,776 |
| 98 | New Mexico | 140,542 |
| 99 | Idaho | 128,132 |
| 100 | Puerto Rico | 125,842 |
| 101 | Ecuador | 124,676 |
| 102 | Kenya | 124,499 |
| 103 | Dominican Republic | 124,282 |
| 104 | New Hampshire | 121,189 |
| 105 | Hawaii | 115,627 |
| 106 | Uzbekistan | 114,965 |
| 107 | Guatemala | 113,200 |
| 108 | Bulgaria | 112,212 |
| 109 | West Virginia | 107,660 |
| 110 | Oman | 106,943 |
| 111 | Delaware | 103,253 |
| 112 | Sri Lanka | 98,963 |
| 113 | Maine | 98,606 |
| 114 | Costa Rica | 95,350 |
| 115 | Luxembourg | 93,197 |
| 116 | Croatia | 92,526 |
| 117 | Serbia | 89,084 |
| 118 | Ivory Coast | 86,538 |
| 119 | Panama | 86,260 |
| 120 | Lithuania | 84,869 |
| 121 | Ghana | 82,825 |
| 122 | Rhode Island | 82,493 |
| 123 | Uruguay | 80,962 |
| 124 | Angola | 80,397 |
| 125 | Tanzania | 78,780 |
| 126 | Montana | 75,999 |
| 127 | Belarus | 75,962 |
| 128 | North Dakota | 75,399 |
| 129 | South Dakota | 75,179 |
| 130 | Azerbaijan | 74,316 |
| 131 | Myanmar | 74,080 |
| 132 | Slovenia | 72,485 |
| 133 | DR Congo | 70,749 |
| 134 | Alaska | 69,969 |
| 135 | Turkmenistan | 64,240 |
| 136 | Uganda | 53,652 |
| 137 | Tunisia | 53,410 |
| 138 | Jordan | 53,352 |
| 139 | Wyoming | 52,946 |
| 140 | Cameroon | 51,327 |
| 141 | Macau | 50,183 |
| 142 | Sudan | 49,910 |
| 143 | Bolivia | 49,668 |
| 144 | Bahrain | 47,737 |
| 145 | Libya | 46,636 |
| 146 | Cambodia | 46,353 |
| 147 | Vermont | 45,707 |
| 148 | Paraguay | 44,458 |
US states by GDP per capita if they were sovereign states
An orange background indicates a US state or District of Columbia.
| Rank | US state or country or territory | GDP (US dollars) |
|---|---|---|
| 1 | District of Columbia | 263,220 |
| 2 | Monaco | 256,581 |
| 3 | Liechtenstein | 207,973 |
| 4 | Bermuda | 138,935 |
| 5 | Luxembourg | 137,516 |
| 6 | New York | 117,332 |
| 7 | Massachusetts | 110,561 |
| 8 | Washington | 108,468 |
| 9 | Ireland | 107,316 |
| 10 | California | 104,916 |
| 11 | Switzerland | 103,670 |
| 12 | Connecticut | 100,235 |
| 13 | Delaware | 98,055 |
| 14 | Cayman Islands | 97,750 |
| 15 | North Dakota | 95,982 |
| 16 | Alaska | 95,147 |
| 17 | Nebraska | 93,145 |
| 18 | Colorado | 93,026 |
| 19 | Singapore | 90,674 |
| 20 | Illinois | 90,449 |
| 21 | Wyoming | 90,335 |
| 22 | New Jersey | 90,272 |
| 23 | Isle of Man | 88,329 |
| 24 | Maryland | 87,021 |
| 25 | Texas | 86,987 |
| 26 | Norway | 86,810 |
| 27 | Virginia | 86,747 |
| 28 | Utah | 86,506 |
| 29 | Minnesota | 86,371 |
| 30 | New Hampshire | 85,518 |
| 31 | Iceland | 82,704 |
| 32 | Nevada | 80,880 |
| 33 | South Dakota | 80,685 |
| 34 | Hawaii | 80,325 |
| 35 | Iowa | 79,631 |
| 36 | Kansas | 79,513 |
| 37 | Georgia (U.S. state) | 78,754 |
| 38 | Pennsylvania | 78,544 |
| 39 | Ohio | 78,120 |
| 40 | Oregon | 77,916 |
| 41 | Qatar | 76,276 |
| 42 | Indiana | 76,004 |
| 43 | North Carolina | 75,876 |
| 44 | Tennessee | 75,748 |
| 45 | Wisconsin | 75,605 |
| 46 | Rhode Island | 74,594 |
| 47 | Channel Islands | 74,589 |
| 48 | Florida | 73,784 |
| 49 | Arizona | 73,203 |
| 50 | Macau | 73,047 |
| 51 | Missouri | 72,108 |
| 52 | Denmark | 71,852 |
| 53 | Faroe Islands | 71,774 |
| 54 | Louisiana | 71,642 |
| 55 | Michigan | 71,083 |
| 56 | Vermont | 70,131 |
| 57 | Maine | 69,803 |
| 58 | Netherlands | 68,219 |
| 59 | Montana | 66,379 |
| 60 | New Mexico | 66,229 |
| 61 | Oklahoma | 64,719 |
| 62 | Australia | 64,408 |
| 63 | Kentucky | 64,110 |
| 64 | Idaho | 63,991 |
| 65 | South Carolina | 63,711 |
| 66 | Alabama | 61,846 |
| 67 | West Virginia | 60,783 |
| 68 | Arkansas | 60,276 |
| 69 | Greenland | 58,499 |
| 70 | Sweden | 57,723 |
| 71 | Austria | 56,833 |
| 72 | Germany | 55,800 |
| 73 | Belgium | 55,723 |
| 74 | Canada | 54,283 |
| 75 | San Marino | 54,265 |
| 76 | Israel | 54,177 |
| 77 | Hong Kong | 54,107 |
| 78 | Finland | 53,189 |
| 79 | Mississippi | 53,061 |
| 80 | United Kingdom | 52,637 |
See also
- List of countries by GDP (nominal)
- Economy of the United States
- List of U.S. states by adjusted per capita personal income
- List of U.S. states and territories by economic growth rate
- List of U.S. states and territories by GDP per capita
- List of U.S. state economies
- List of cities by GDP
- List of U.S. metropolitan areas by GDP
- List of U.S. metropolitan areas by GDP per capita
- Thank God for Mississippi
References
- ^ a b c d e f g "GDP by State". GDP by State | U.S. Bureau of Economic Analysis (BEA). Bureau of Economic Analysis. Retrieved April 10, 2022.
- ^ a b "New Vintage 2021 Population Estimates Available for the Nation, States and Puerto Rico". New Vintage 2021 Population Estimates Available for the Nation, States and Puerto Rico. United States Census Bureau. December 21, 2021. Retrieved April 10, 2022.
- ^ "World Bank Open Data". World Bank Open Data. Retrieved March 28, 2024.
- ^ "GDP for American Samoa". Bureau of Economic Analysis. Retrieved March 28, 2024.
- ^ "GDP for Guam". Bureau of Economic Analysis. Retrieved March 28, 2024.
- ^ "GDP for the Commonwealth of the Northern Mariana Islands (CNMI)". Bureau of Economic Analysis. Retrieved November 24, 2024.
- ^ "GDP for the U.S. Virgin Islands (USVI)". Bureau of Economic Analysis. Retrieved June 27, 2024.
- ^ "GDP for Puerto Rico". Bureau of Economic Analysis. Retrieved August 17, 2025.