Crowfoot (electoral district)
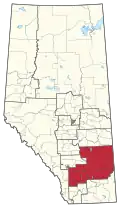
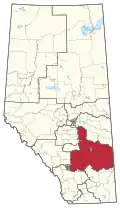
_-_Crowfoot.svg.png) Crowfoot in relation to the other Alberta ridings (2003 boundaries) | |
| Defunct federal electoral district | |
| Legislature | House of Commons |
| District created | 1966 |
| District abolished | 2013 |
| First contested | 1968 |
| Last contested | 2011 |
| District webpage | profile, map |
| Demographics | |
| Population (2011)[1] | 125,481 |
| Electors (2011) | 87,897 |
| Area (km²)[2] | 42,810.46 |
| Census division(s) | Division No. 5, Division No. 6, Division No. 7, Division No. 10 |
| Census subdivision(s) | Rocky View County, Camrose, Mountain View County, Strathmore, Chestermere, Wheatland County, Drumheller, Camrose County, Stettler, Kneehill County |
Crowfoot was a federal electoral district in Alberta, Canada, that was represented in the House of Commons of Canada from 1968 to 2015.
It was located in the central part of the province, and is named in honour of Chief Crowfoot, leader of the Blackfoot First Nations in the 19th century.
Even by the standards of rural Alberta, Crowfoot was a strongly conservative riding. The major right-wing party of the day — Progressive Conservative (1968–1993), Reform (1993–2000), Canadian Alliance (2000–2003), and Conservative (after 2003) — won every election in this riding, usually by some of the largest recorded margins in Canadian politics. As a measure of how conservative this riding is, Jack Horner, the riding's original member, crossed the floor to the Liberals in 1977, only to tumble to only 18 percent of the vote in 1979.
This electoral district was also home to the largest margin of victory in any federal riding in the 2004 and 2006 federal elections. Conservative candidate Kevin Sorenson won 37,649 votes, or 80.2% of the riding's total in 2004. This represented a difference of 34,034 votes, or 72.5%, from the candidate with the riding's second most votes, Liberal Adam Campbell who only received 3,615 votes, or 7.7% of the riding's votes. It was the riding with the highest Conservative vote in the 2004 and 2006 elections. In 2006, Sorenson increased his vote even further, to 43,009 votes, 82.5% of the total.
Geography
The district included the City of Camrose; the Town of Drumheller; the Municipal District of Acadia No. 34; Wheatland County; Kneehill County; Starland County; the County of Stettler No. 6; the County of Paintearth No. 18; Camrose County; and all of Alberta's three special areas (Nos. 2, 3 and 4).
History
This riding was created in 1966 from parts of Medicine Hat, Acadia, Bow River, and Macleod ridings. At the time, the riding contained the rural areas south and east of Calgary, extending as far south as Claresholm and as far east as the Saskatchewan border. It also extended into the rural area of east-central Alberta as far north as Coronation.
Redistribution in 1976 altered the riding drastically. The riding lost all of its territory south of the Red Deer River, which was transferred to ridings of Bow River and Medicine Hat. In turn, the riding moved northward, taking up most of rural east-central Alberta, adding much of what was previously in the riding of Battle River. The riding would now extend as far north as the Highway 13 corridor, including Camrose.
The 1987 redistribution added the Drumheller area to the riding, as well as the Red Deer River valley area north of Drumheller from the ridings of Red Deer and Bow River. In turn, the riding lost most of the Highway 13 corridor in the north to Vegreville except for the Camrose area.
The 1996 redistribution added the Highway 13 corridor back to the riding.
In 2003, parts of Wild Rose riding were added, including the eastern exurbs of Calgary, like Chestemere. The riding subsequently lost the Highway 21 corridor east of Red Deer to the ridings of Red Deer and Wetaskiwin, and lost the Highway 13 corridor (except for Camrose) to Vegreville—Wainwright.
It was abolished in 2012. Most of the riding's eastern portion became Battle River—Crowfoot, with much of the western portion transferring to Bow River and Red Deer—Mountain View. Some outer western portions of the riding that had been annexed into Calgary joined Calgary Shepard and Calgary Forest Lawn.
Historical boundaries
-
 1966 representation order
 -
 1976 representation order
 -
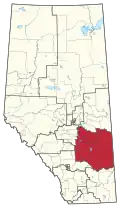
 1987 representation order
 -
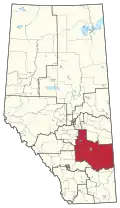
 1996 representation order
 -
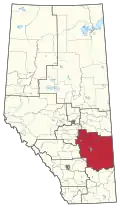
 2003 representation order
Members of Parliament
| Parliament | Years | Member | Party | |
|---|---|---|---|---|
| Crowfoot Riding created from Medicine Hat, Acadia, Bow River and Macleod |
||||
| 28th | 1968–1972 | Jack Horner | Progressive Conservative | |
| 29th | 1972–1974 | |||
| 30th | 1974–1977 | |||
| 1977–1979 | Liberal | |||
| 31st | 1979–1980 | Arnold Malone | Progressive Conservative | |
| 32nd | 1980–1984 | |||
| 33rd | 1984–1988 | |||
| 34th | 1988–1993 | |||
| 35th | 1993–1997 | Jack Ramsay | Reform | |
| 36th | 1997–2000 | |||
| 2000–2000 | Independent Canadian Alliance | |||
| 2000–2000 | Independent | |||
| 37th | 2000–2003 | Kevin Sorenson | Alliance | |
| 2003–2004 | Conservative | |||
| 38th | 2004–2006 | |||
| 39th | 2006–2008 | |||
| 40th | 2008–2011 | |||
| 41st | 2011–2015 | |||
| Riding dissolved into Battle River—Crowfoot, Bow River, Red Deer—Mountain View, Calgary Shepard and Calgary Forest Lawn |
||||
Election results
| 2011 Canadian federal election | ||||||||
|---|---|---|---|---|---|---|---|---|
| Party | Candidate | Votes | % | ±% | Expenditures | |||
| Conservative | Kevin Sorenson | 44,115 | 83.99 | +1.96 | $33,424 | |||
| New Democratic | Ellen Parker | 4,805 | 9.15 | +1.26 | $10,007 | |||
| Green | Konrad Schellenberg | 1,711 | 3.26 | -2.74 | $0 | |||
| Liberal | Omar Harb | 1,224 | 2.33 | -1.75 | $4,589 | |||
| Independent | John C. Turner | 463 | 0.88 | – | $2,667 | |||
| Christian Heritage | Gerard Groenedijk | 204 | 0.39 | – | ||||
| Total valid votes/Expense limit | 52,522 | 99.75 | ||||||
| Total rejected ballots | 131 | 0.25 | -0.02 | |||||
| Turnout | 52,653 | 59.24 | +4.38 | |||||
| Eligible voters | 88,881 | – | – | |||||
| Conservative hold | Swing | +0.35 | ||||||
| 2008 Canadian federal election | ||||||||
|---|---|---|---|---|---|---|---|---|
| Party | Candidate | Votes | % | ±% | Expenditures | |||
| Conservative | Kevin Sorenson | 39,342 | 82.03 | -0.52 | $63,199 | |||
| New Democratic | Ellen Parker | 3,783 | 7.89 | +0.48 | $5,585 | |||
| Green | Kaitlin Kettenbach | 2,875 | 5.99 | +1.51 | ||||
| Liberal | Sharon Howe | 1,958 | 4.08 | -1.47 | $1,397 | |||
| Total valid votes/Expense limit | 47,958 | 99.74 | $106,273 | |||||
| Total rejected ballots | 127 | 0.26 | -0.01 | |||||
| Turnout | 48,085 | 54.86 | -9.94 | |||||
| Eligible voters | 87,644 | – | – | |||||
| Conservative hold | Swing | -0.50 | ||||||
| 2006 Canadian federal election | ||||||||
|---|---|---|---|---|---|---|---|---|
| Party | Candidate | Votes | % | ±% | ||||
| Conservative | Kevin Sorenson | 43,210 | 82.56 | +2.35 | ||||
| New Democratic | Ellen Parker | 3,875 | 7.40 | +0.50 | ||||
| Liberal | Adam Campbell | 2,908 | 5.56 | -2.15 | ||||
| Green | Cameron Wigmore | 2,347 | 4.48 | +0.66 | ||||
| Total valid votes | 52,340 | 99.73 | ||||||
| Total rejected ballots | 142 | 0.27 | +0.08 | |||||
| Turnout | 52,482 | 64.81 | +2.44 | |||||
| Eligible voters | 80,980 | – | – | |||||
| Conservative hold | Swing | +0.92 | ||||||
| 2004 Canadian federal election | ||||||||
|---|---|---|---|---|---|---|---|---|
| Party | Candidate | Votes | % | ±% | Expenditures | |||
| Conservative | Kevin Sorenson | 37,649 | 80.21 | -5.53 | $43,903 | |||
| Liberal | Adam Campbell | 3,615 | 7.70 | +1.17 | $3,455 | |||
| New Democratic | Ellen Parker | 3,241 | 6.90 | +3.96 | $2,514 | |||
| Green | Arnold Baker | 1,795 | 3.82 | – | ||||
| Marijuana | Max Leonard Cornelssen | 639 | 1.36 | – | ||||
| Total valid votes | 46,939 | 99.81 | ||||||
| Total rejected ballots | 89 | 0.19 | ||||||
| Turnout | 47,028 | 62.36 | ||||||
| Eligible voters | 75,409 | – | – | |||||
| Conservative notional hold | Swing | -3.35 | ||||||
Note: Change from redistributed results. Conservative vote is compared to the total of Progressive Conservative and Canadian Alliance vote in 2000.
| 2000 federal election redistributed results[3] | |||
|---|---|---|---|
| Party | Vote | % | |
| Canadian Alliance | 33,988 | 71.72 | |
| Progressive Conservative | 6,641 | 14.01 | |
| Liberal | 3,094 | 6.53 | |
| New Democratic | 1,396 | 2.95 | |
| Independents | 2,269 | 4.79 | |
| 2000 Canadian federal election | ||||||||
|---|---|---|---|---|---|---|---|---|
| Party | Candidate | Votes | % | ±% | Expenditures | |||
| Alliance | Kevin Sorenson | 33,767 | 70.56 | -0.43 | $44,001 | |||
| Progressive Conservative | Verlyn Olson | 6,778 | 14.16 | -1.34 | $18,591 | |||
| Liberal | Orest Werezak | 2,964 | 6.19 | -3.52 | $2,938 | |||
| Independent | Jack Ramsay | 2,668 | 5.57 | – | $18,085 | |||
| New Democratic | Jay Russell | 1,457 | 3.04 | -0.75 | $788 | |||
| Independent | Valerie Morrow | 223 | 0.47 | – | $7,959 | |||
| Total valid votes | 47,857 | 99.76 | ||||||
| Total rejected ballots | 117 | 0.24 | +0.06 | |||||
| Turnout | 47,974 | 66.18 | +2.12 | |||||
| Eligible voters | 72,488 | – | – | |||||
| Alliance hold | Swing | +0.45 | ||||||
Note: Canadian Alliance vote is compared to the Reform vote in 1997.
| 1997 Canadian federal election | ||||||||
|---|---|---|---|---|---|---|---|---|
| Party | Candidate | Votes | % | ±% | Expenditures | |||
| Reform | Jack Ramsay | 30,589 | 70.99 | +5.01 | $48,007 | |||
| Progressive Conservative | Paul Marshall | 6,679 | 15.50 | -2.47 | $18,052 | |||
| Liberal | Redford W. Peeples | 4,185 | 9.71 | -2.88 | $5,178 | |||
| New Democratic | Bill Scotten | 1,635 | 3.79 | +1.39 | $859 | |||
| Total valid votes | 43,088 | 99.82 | ||||||
| Total rejected ballots | 79 | 0.18 | -0.04 | |||||
| Turnout | 43,167 | 64.06 | -7.28 | |||||
| Eligible voters | 67,387 | – | – | |||||
| Reform hold | Swing | +3.74 | ||||||
| 1993 Canadian federal election | ||||||||
|---|---|---|---|---|---|---|---|---|
| Party | Candidate | Votes | % | ±% | ||||
| Reform | Jack Ramsay | 23,611 | 65.98 | +33.93 | ||||
| Progressive Conservative | Brian Heidecker | 6,431 | 17.97 | -35.71 | ||||
| Liberal | Darryl Sandford | 4,506 | 12.59 | +6.00 | ||||
| New Democratic | Berend J. Wilting | 860 | 2.40 | -5.26 | ||||
| Natural Law | Alan J. Livingston | 263 | 0.73 | |||||
| Independent | Anita Ashmore | 113 | 0.32 | |||||
| Total valid votes | 35,785 | 99.78 | ||||||
| Total rejected ballots | 80 | 0.22 | +0.01 | |||||
| Turnout | 35,865 | 71.34 | -6.95 | |||||
| Eligible voters | 50,275 | – | – | |||||
| Reform gain from Progressive Conservative | Swing | +34.82 | ||||||
| 1988 Canadian federal election | ||||||||
|---|---|---|---|---|---|---|---|---|
| Party | Candidate | Votes | % | ±% | ||||
| Progressive Conservative | Arnold Malone | 19,079 | 53.68 | -24.15 | ||||
| Reform | Jack Ramsay | 11,392 | 32.05 | |||||
| New Democratic | Fred Rappel | 2,725 | 7.67 | -1.67 | ||||
| Liberal | Doug Moe | 2,344 | 6.60 | -0.76 | ||||
| Total valid votes | 35,540 | 99.78 | ||||||
| Total rejected ballots | 77 | 0.22 | -0.01 | |||||
| Turnout | 35,617 | 78.28 | +5.10 | |||||
| Eligible voters | 45,499 | – | – | |||||
| Progressive Conservative hold | Swing | -28.10 | ||||||
| Source: Thirty Fourth General Election: Report of the Chief Electoral Officer | ||||||||
| 1984 Canadian federal election | ||||||||
|---|---|---|---|---|---|---|---|---|
| Party | Candidate | Votes | % | ±% | ||||
| Progressive Conservative | Arnold Malone | 26,291 | 77.83 | +1.22 | ||||
| New Democratic | L. Gladys Creasy | 3,153 | 9.33 | +3.10 | ||||
| Liberal | Vange MacNaughton | 2,483 | 7.35 | -8.18 | ||||
| Confederation of Regions | Joe Domanski | 1,559 | 4.62 | |||||
| Social Credit | Arthur E. Robinson | 294 | 0.87 | -0.75 | ||||
| Total valid votes | 33,780 | 99.77 | ||||||
| Total rejected ballots | 78 | 0.23 | -0.00 | |||||
| Turnout | 33,858 | 73.18 | +2.37 | |||||
| Eligible voters | 46,266 | – | – | |||||
| Progressive Conservative hold | Swing | -0.94 | ||||||
| 1980 Canadian federal election | ||||||||
|---|---|---|---|---|---|---|---|---|
| Party | Candidate | Votes | % | ±% | ||||
| Progressive Conservative | Arnold Malone | 23,491 | 76.61 | -0.51 | ||||
| Liberal | Jack Horner | 4,761 | 15.53 | -2.67 | ||||
| New Democratic | Roger Milbrandt | 1,912 | 6.24 | +1.56 | ||||
| Social Credit | Jim Green | 498 | 1.62 | |||||
| Total valid votes | 30,662 | 99.77 | ||||||
| Total rejected ballots | 71 | 0.23 | ||||||
| Turnout | 30,733 | 70.81 | ||||||
| Eligible voters | 43,402 | – | – | |||||
| Progressive Conservative hold | Swing | +1.08 | ||||||
| 1979 Canadian federal election | ||||||||
|---|---|---|---|---|---|---|---|---|
| Party | Candidate | Votes | % | ±% | ||||
| Progressive Conservative | Arnold Malone | 25,202 | 77.12 | +1.62 | ||||
| Liberal | Jack Horner | 5,947 | 18.20 | +3.65 | ||||
| New Democratic | Roger Milbrandt | 1,529 | 4.68 | +0.20 | ||||
| Total valid votes | 32,678 | 100.00 | ||||||
| 1974 Canadian federal election | ||||||||
|---|---|---|---|---|---|---|---|---|
| Party | Candidate | Votes | % | ±% | ||||
| Progressive Conservative | Jack Horner | 18,048 | 75.51 | -0.03 | ||||
| Liberal | Ernest R. Patterson | 3,477 | 14.55 | +4.06 | ||||
| Social Credit | Jim Green | 1,307 | 5.47 | -1.69 | ||||
| New Democratic | Muriel McCreary | 1,071 | 4.48 | -2.34 | ||||
| Total valid votes | 23,903 | 100.00 | ||||||
| 1972 Canadian federal election | ||||||||
|---|---|---|---|---|---|---|---|---|
| Party | Candidate | Votes | % | ±% | ||||
| Progressive Conservative | Jack Horner | 18,667 | 75.54 | +2.09 | ||||
| Liberal | Andy McAlister | 2,591 | 10.48 | -10.80 | ||||
| Social Credit | Jim Green | 1,768 | 7.15 | |||||
| New Democratic | Gloria Jean Ann Mcgowan | 1,686 | 6.82 | +1.55 | ||||
| Total valid votes | 24,712 | 100.00 | ||||||
| 1968 Canadian federal election | ||||||||
|---|---|---|---|---|---|---|---|---|
| Party | Candidate | Votes | % | |||||
| Progressive Conservative | Jack Horner | 16,508 | 73.45 | |||||
| Liberal | Noel Sharp | 4,783 | 21.28 | |||||
| New Democratic | Stuart McCready | 1,185 | 5.27 | |||||
| Total valid votes | 22,476 | 100.00 | ||||||
See also
References
- ^ Statistics Canada: 2011
- ^ Statistics Canada: 2011
- ^ Election Prediction Project
- "Crowfoot (electoral district) (Code 48010) Census Profile". 2011 census. Government of Canada - Statistics Canada. Retrieved 6 March 2011.
- Riding history for Crowfoot from the Library of Parliament
- 2011 results from Elections Canada
- Expenditures - 2008
- Expenditures - 2004
- Expenditures - 2000
- Expenditures - 1997
External links
- Elections Canada
- Website of the Parliament of Canada