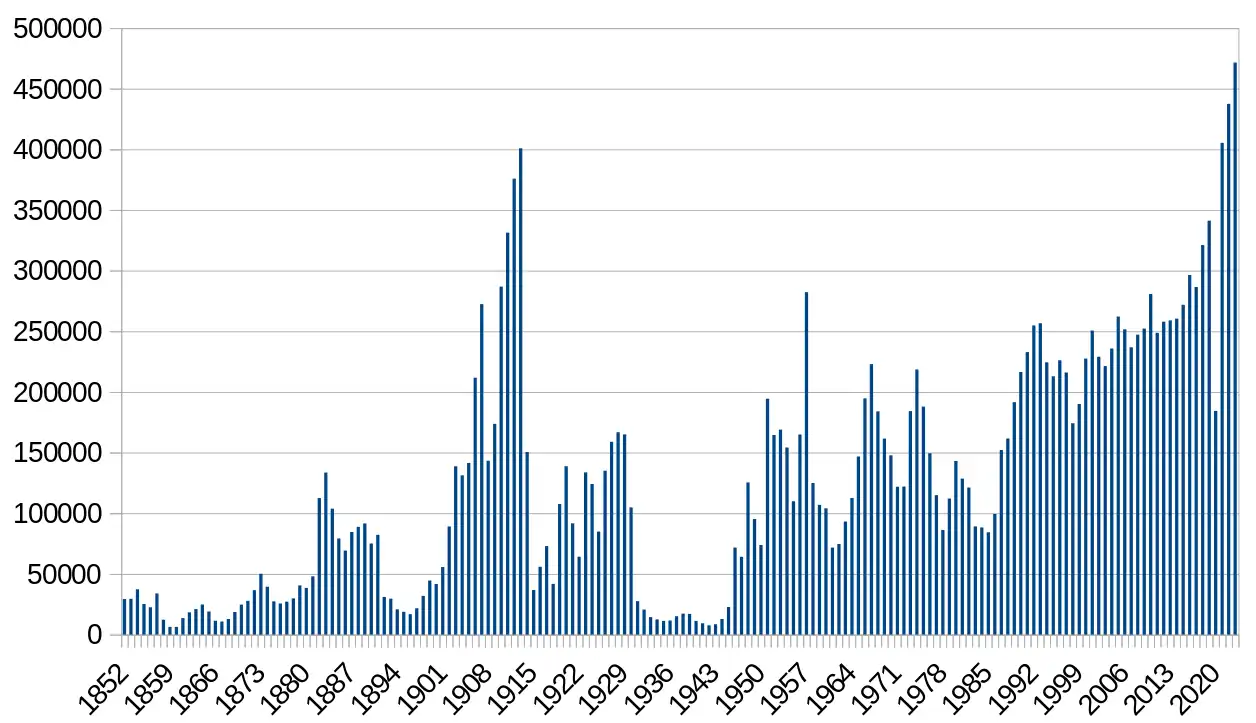
Since before confederation in 1867 through to the contemporary era, decadal and demi-decadal census reports in Canada have compiled detailed immigration statistics. During this period, the highest annual immigration rate in Canada occurred in 1913, when 400,900 new immigrants accounted for 5.3 percent of the total population,[1][2] while the greatest number of immigrants admitted to Canada in single year occurred in 2024, with 483,640 persons accounting for 1.2 percent of the total population.[3][4][5][6]
In a linear timeline following initial British and French colonization, what is now Canada has seen four major waves (or peaks) of immigration and settlement of non-Indigenous Peoples take place over a span of nearly two centuries. Canada is currently undergoing its fifth wave.
Annual immigration and rate
Since confederation in 1867, the highest annual immigration rate in Canada occurred during the early 20th century, including 1913 (new immigrants accounted for 5.3 percent of the total population), 1912 (5.1 percent), 1911 (4.6 percent), 1907 (4.3 percent) and 1910 (4.1 percent).[2][1] At this time, immigration from the British Isles increased, supplemented by a rapid increase in immigration flows from continental Europe, especially Germany, Scandinavia, and the Soviet Union.
Annual immigration statistics
1852 to 1897
| Year
|
Total
population
|
Number of
immigrants
|
Immigration
rate
|
| 1852
|
2,414,519
|
29,300
|
1.21%
|
| 1853
|
N/A
|
29,500
|
N/A
|
| 1854
|
N/A
|
37,300
|
N/A
|
| 1855
|
N/A
|
25,300
|
N/A
|
| 1856
|
N/A
|
22,500
|
N/A
|
| 1857
|
N/A
|
33,900
|
N/A
|
| 1858
|
N/A
|
12,300
|
N/A
|
| 1859
|
N/A
|
6,300
|
N/A
|
| 1860
|
N/A
|
6,300
|
N/A
|
| 1861
|
3,174,442
|
13,600
|
0.43%
|
| 1862
|
N/A
|
18,300
|
N/A
|
| 1863
|
N/A
|
21,000
|
N/A
|
| 1864
|
N/A
|
24,800
|
N/A
|
| 1865
|
N/A
|
19,000
|
N/A
|
| 1866
|
N/A
|
11,400
|
N/A
|
| 1867
|
3,463,000
|
10,700
|
0.31%
|
| 1868
|
3,511,000
|
12,800
|
0.36%
|
| 1869
|
3,565,000
|
18,600
|
0.52%
|
| 1870
|
3,625,000
|
24,700
|
0.68%
|
| 1871
|
3,689,000
|
27,800
|
0.75%
|
| 1872
|
3,754,000
|
36,600
|
0.97%
|
| 1873
|
3,826,000
|
50,100
|
1.31%
|
| 1874
|
3,895,000
|
39,400
|
1.01%
|
| 1875
|
3,954,000
|
27,400
|
0.69%
|
| 1876
|
4,009,000
|
25,600
|
0.64%
|
| 1877
|
4,064,000
|
27,100
|
0.67%
|
| 1878
|
4,120,000
|
29,800
|
0.72%
|
| 1879
|
4,185,000
|
40,500
|
0.97%
|
| 1880
|
4,255,000
|
38,500
|
0.9%
|
| 1881
|
4,325,000
|
48,000
|
1.11%
|
| 1882
|
4,375,000
|
112,500
|
2.57%
|
| 1883
|
4,430,000
|
133,600
|
3.02%
|
| 1884
|
4,487,000
|
103,800
|
2.31%
|
| 1885
|
4,537,000
|
79,200
|
1.75%
|
| 1886
|
4,580,000
|
69,200
|
1.51%
|
| 1887
|
4,626,000
|
84,500
|
1.83%
|
| 1888
|
4,678,000
|
88,800
|
1.9%
|
| 1889
|
4,729,000
|
91,600
|
1.94%
|
| 1890
|
4,779,000
|
75,100
|
1.57%
|
| 1891
|
4,833,000
|
82,200
|
1.7%
|
| 1892
|
4,883,000
|
31,000
|
0.63%
|
| 1893
|
4,931,000
|
29,600
|
0.6%
|
| 1894
|
4,979,000
|
20,800
|
0.42%
|
| 1895
|
5,026,000
|
18,800
|
0.37%
|
| 1896
|
5,074,000
|
16,800
|
0.33%
|
| 1897
|
5,122,000
|
21,700
|
0.42%
|
Sources:[1][2]
|
Annual immigration statistics
1898 to 1943
| Year
|
Total
population
|
Number of
immigrants
|
Immigration
rate
|
| 1898
|
5,175,000
|
31,900
|
0.62%
|
| 1899
|
5,235,000
|
44,500
|
0.85%
|
| 1900
|
5,301,000
|
41,700
|
0.79%
|
| 1901
|
5,371,000
|
55,700
|
1.04%
|
| 1902
|
5,494,000
|
89,100
|
1.62%
|
| 1903
|
5,651,000
|
138,700
|
2.45%
|
| 1904
|
5,827,000
|
131,300
|
2.25%
|
| 1905
|
6,002,000
|
141,500
|
2.36%
|
| 1906
|
6,097,000
|
211,700
|
3.47%
|
| 1907
|
6,411,000
|
272,400
|
4.25%
|
| 1908
|
6,625,000
|
143,300
|
2.16%
|
| 1909
|
6,800,000
|
173,700
|
2.55%
|
| 1910
|
6,988,000
|
286,800
|
4.1%
|
| 1911
|
7,207,000
|
331,300
|
4.6%
|
| 1912
|
7,389,000
|
375,800
|
5.09%
|
| 1913
|
7,632,000
|
400,900
|
5.25%
|
| 1914
|
7,879,000
|
150,500
|
1.91%
|
| 1915
|
7,981,000
|
36,700
|
0.46%
|
| 1916
|
8,001,000
|
55,900
|
0.7%
|
| 1917
|
8,060,000
|
72,900
|
0.9%
|
| 1918
|
8,148,000
|
41,800
|
0.51%
|
| 1919
|
8,311,000
|
107,700
|
1.3%
|
| 1920
|
8,556,000
|
138,800
|
1.62%
|
| 1921
|
8,788,000
|
91,700
|
1.04%
|
| 1922
|
8,919,000
|
64,200
|
0.72%
|
| 1923
|
9,010,000
|
133,700
|
1.48%
|
| 1924
|
9,143,000
|
124,200
|
1.36%
|
| 1925
|
9,294,000
|
84,900
|
0.91%
|
| 1926
|
9,451,000
|
135,100
|
1.43%
|
| 1927
|
9,637,000
|
158,900
|
1.65%
|
| 1928
|
9,835,000
|
166,800
|
1.7%
|
| 1929
|
10,029,000
|
165,000
|
1.65%
|
| 1930
|
10,208,000
|
104,800
|
1.03%
|
| 1931
|
10,377,000
|
27,500
|
0.27%
|
| 1932
|
10,510,000
|
20,600
|
0.2%
|
| 1933
|
10,633,000
|
14,400
|
0.14%
|
| 1934
|
10,741,000
|
12,500
|
0.12%
|
| 1935
|
10,845,000
|
11,300
|
0.1%
|
| 1936
|
10,950,000
|
11,600
|
0.11%
|
| 1937
|
11,045,000
|
15,100
|
0.14%
|
| 1938
|
11,152,000
|
17,200
|
0.15%
|
| 1939
|
11,267,000
|
17,000
|
0.15%
|
| 1940
|
11,381,000
|
11,300
|
0.1%
|
| 1941
|
11,507,000
|
9,300
|
0.08%
|
| 1942
|
11,654,000
|
7,600
|
0.07%
|
| 1943
|
11,795,000
|
8,500
|
0.07%
|
Sources:[1][2]
|
Annual immigration statistics
1944 to 1985
| Year
|
Total
population
|
Number of
immigrants
|
Immigration
rate
|
| 1944
|
11,946,000
|
12,800
|
0.11%
|
| 1945
|
12,072,000
|
22,700
|
0.19%
|
| 1946
|
12,292,000
|
71,700
|
0.58%
|
| 1947
|
12,551,000
|
64,100
|
0.51%
|
| 1948
|
12,823,000
|
125,400
|
0.98%
|
| 1949
|
13,447,000
|
95,200
|
0.71%
|
| 1950
|
13,712,000
|
73,900
|
0.54%
|
| 1951
|
14,009,000
|
194,400
|
1.39%
|
| 1952
|
14,459,000
|
164,500
|
1.14%
|
| 1953
|
14,845,000
|
168,900
|
1.14%
|
| 1954
|
15,287,000
|
154,200
|
1.01%
|
| 1955
|
15,698,000
|
109,900
|
0.7%
|
| 1956
|
16,081,000
|
164,900
|
1.03%
|
| 1957
|
16,610,000
|
282,200
|
1.7%
|
| 1958
|
17,080,000
|
124,900
|
0.73%
|
| 1959
|
17,483,000
|
106,900
|
0.61%
|
| 1960
|
17,870,000
|
104,100
|
0.58%
|
| 1961
|
18,238,000
|
71,700
|
0.39%
|
| 1962
|
18,583,000
|
74,600
|
0.4%
|
| 1963
|
18,931,000
|
93,200
|
0.49%
|
| 1964
|
19,291,000
|
112,600
|
0.58%
|
| 1965
|
19,644,000
|
146,800
|
0.75%
|
| 1966
|
20,015,000
|
194,700
|
0.97%
|
| 1967
|
20,378,000
|
222,900
|
1.09%
|
| 1968
|
20,701,000
|
184,000
|
0.89%
|
| 1969
|
21,001,000
|
161,500
|
0.77%
|
| 1970
|
21,297,000
|
147,700
|
0.69%
|
| 1971
|
21,962,032
|
121,900
|
0.56%
|
| 1972
|
22,218,463
|
122,000
|
0.55%
|
| 1973
|
22,491,777
|
184,200
|
0.82%
|
| 1974
|
22,807,969
|
218,500
|
0.96%
|
| 1975
|
23,143,275
|
187,900
|
0.81%
|
| 1976
|
23,449,808
|
149,400
|
0.64%
|
| 1977
|
23,725,843
|
114,900
|
0.48%
|
| 1978
|
23,963,203
|
86,300
|
0.36%
|
| 1979
|
24,201,544
|
112,100
|
0.46%
|
| 1980
|
24,515,667
|
143,100
|
0.58%
|
| 1981
|
24,819,915
|
128,600
|
0.52%
|
| 1982
|
25,116,942
|
121,200
|
0.48%
|
| 1983
|
25,366,451
|
89,200
|
0.35%
|
| 1984
|
25,607,053
|
88,300
|
0.34%
|
| 1985
|
25,842,116
|
84,300
|
0.33%
|
Sources:[1][6][2][7][8][9][10][11][12]
|
Annual immigration statistics
1986 to 2024
| Year
|
Total
population
|
Number of
immigrants
|
Immigration
rate
|
| 1986
|
26,100,278
|
99,400
|
0.38%
|
| 1987
|
26,446,601
|
152,100
|
0.58%
|
| 1988
|
26,791,747
|
161,600
|
0.6%
|
| 1989
|
27,276,781
|
191,600
|
0.7%
|
| 1990
|
27,691,138
|
216,500
|
0.78%
|
| 1991
|
28,037,420
|
232,800
|
0.83%
|
| 1992
|
28,371,264
|
254,800
|
0.9%
|
| 1993
|
28,684,764
|
256,600
|
0.89%
|
| 1994
|
29,000,663
|
224,400
|
0.77%
|
| 1995
|
29,302,311
|
212,900
|
0.73%
|
| 1996
|
29,610,218
|
226,100
|
0.76%
|
| 1997
|
29,905,948
|
216,000
|
0.72%
|
| 1998
|
30,155,173
|
174,200
|
0.58%
|
| 1999
|
30,401,286
|
190,000
|
0.62%
|
| 2000
|
30,685,730
|
227,500
|
0.74%
|
| 2001
|
31,020,902
|
250,600
|
0.81%
|
| 2002
|
31,360,079
|
229,000
|
0.73%
|
| 2003
|
31,644,028
|
221,300
|
0.7%
|
| 2004
|
31,940,655
|
235,800
|
0.74%
|
| 2005
|
32,243,753
|
262,200
|
0.81%
|
| 2006
|
32,571,174
|
251,600
|
0.77%
|
| 2007
|
32,889,025
|
236,800
|
0.72%
|
| 2008
|
33,247,118
|
247,200
|
0.74%
|
| 2009
|
33,628,895
|
252,200
|
0.75%
|
| 2010
|
34,004,889
|
280,700
|
0.83%
|
| 2011
|
34,339,328
|
248,700
|
0.72%
|
| 2012
|
34,714,222
|
257,900
|
0.74%
|
| 2013
|
35,082,954
|
259,000
|
0.74%
|
| 2014
|
35,437,435
|
260,400
|
0.73%
|
| 2015
|
35,702,908
|
271,850
|
0.76%
|
| 2016
|
36,109,487
|
296,350
|
0.82%
|
| 2017
|
36,545,236
|
286,480
|
0.78%
|
| 2018
|
37,065,084
|
321,040
|
0.87%
|
| 2019
|
37,601,230
|
341,180
|
0.91%
|
| 2020
|
38,007,166
|
184,600
|
0.49%
|
| 2021
|
38,226,498
|
406,055
|
1.06%
|
| 2022
|
38,929,902
|
437,630
|
1.12%
|
| 2023
|
40,097,761
|
471,820
|
1.18%
|
| 2024
|
41,288,599
|
483,640
|
1.17%
|
Sources:[1][6][2][9][10][11][3][4]
|
Immigration graph
 .
.
Sources of immigration
Canada receives its immigrant population from almost every country in the world. Statistics Canada projects that immigrants will represent between 29.1% and 34.0% of Canada's population in 2041, compared with 23.0% in 2021,[13] while the Canadian population with at least one foreign born parent (first and second generation persons) could rise to between 49.8% and 54.3%, up from 44.0% in 2021.[14][15][16] The number of visible ethno-cultural composition of population will double and make up the minority of the population of cities in Canada.[17]
2021 census
The 2021 census reported that immigrants comprised 8,361,505 individuals or 23.0 percent of the total Canadian population. Of the total immigrant population, the top countries of origin were India (898,045 persons or 10.7%), Philippines (719,580 persons or 8.6%), China (715,835 persons or 8.6%), United Kingdom (464,135 persons or 5.6%), United States (256,085 persons or 3.1%), Pakistan (234,110 persons or 2.8%), Hong Kong (213,855 persons or 2.6%), Italy (204,065 persons or 2.4%), Iran (182,940 persons or 2.2%), and Vietnam (182,095 persons or 2.2%).[18][19][13]
Total immigrant population by country of birth, 2021 Canadian census[18][19][13]
Immigrant refers to all those who hold or have ever held permanent resident status in Canada, including naturalized citizens.
| Rank
|
Country of birth
|
Immigrant population
|
Proportion of immigrants in Canada
|
Proportion of Canadian population
|
Notes
|
| —
|
.svg.png) Canada Canada
|
8,361,505
|
100%
|
23.02%
|
—
|
| 1
|
 India India
|
898,050
|
10.74%
|
2.47%
|
—
|
| 2
|
 Philippines Philippines
|
719,575
|
8.61%
|
1.98%
|
—
|
| 3
|
 China China
|
715,830
|
8.56%
|
1.97%
|
Officially the People's Republic of China. Excludes Hong Kong and Macau (included in this table below).
|
| 4
|
 United Kingdom United Kingdom
|
464,140
|
5.55%
|
1.28%
|
Officially the United Kingdom of Great Britain and Northern Ireland. Includes Scotland, Wales, England and Northern Ireland. Excludes Isle of Man, the Channel Islands, and British Overseas Territories.
|
| 5
|
 United States United States
|
256,090
|
3.06%
|
0.7%
|
—
|
| 6
|
 Pakistan Pakistan
|
234,105
|
2.8%
|
0.64%
|
—
|
| 7
|
 Hong Kong Hong Kong
|
213,855
|
2.56%
|
0.59%
|
Officially the Hong Kong Special Administrative Region of China.
|
| 8
|
 Italy Italy
|
204,065
|
2.44%
|
0.56%
|
—
|
| 9
|
 Iran Iran
|
182,940
|
2.19%
|
0.5%
|
—
|
| 10
|
 Vietnam Vietnam
|
182,090
|
2.18%
|
0.5%
|
Many from the former Republic of Vietnam
|
| 11
|
 Jamaica Jamaica
|
145,355
|
1.74%
|
0.4%
|
—
|
| 12
|
 South Korea South Korea
|
138,350
|
1.65%
|
0.38%
|
Officially the Republic of Korea.
|
| 13
|
 Sri Lanka Sri Lanka
|
136,240
|
1.63%
|
0.38%
|
—
|
| 14
|
 Poland Poland
|
135,030
|
1.61%
|
0.37%
|
—
|
| 15
|
.svg.png) Portugal Portugal
|
128,800
|
1.54%
|
0.35%
|
—
|
| 16
|
 Germany Germany
|
126,475
|
1.51%
|
0.35%
|
—
|
| 17
|
 France France
|
121,525
|
1.45%
|
0.33%
|
—
|
| 18
|
 Haiti Haiti
|
99,940
|
1.2%
|
0.28%
|
—
|
| 19
|
.svg.png) Syria Syria
|
97,590
|
1.17%
|
0.27%
|
—
|
| 20
|
 Lebanon Lebanon
|
95,725
|
1.14%
|
0.26%
|
—
|
| 21
|
 Mexico Mexico
|
90,585
|
1.08%
|
0.25%
|
—
|
| 22
|
 Romania Romania
|
86,765
|
1.04%
|
0.24%
|
—
|
| 23
|
 Guyana Guyana
|
85,530
|
1.02%
|
0.24%
|
—
|
| 24
|
 Iraq Iraq
|
84,125
|
1.01%
|
0.23%
|
—
|
| 25
|
 Russia Russia
|
81,840
|
0.98%
|
0.23%
|
—
|
| 26
|
 Morocco Morocco
|
81,775
|
0.98%
|
0.23%
|
—
|
| 27
|
 Nigeria Nigeria
|
81,290
|
0.97%
|
0.22%
|
—
|
| 28
|
 Ukraine Ukraine
|
81,135
|
0.97%
|
0.22%
|
—
|
| 29
|
 Colombia Colombia
|
80,570
|
0.96%
|
0.22%
|
—
|
| 30
|
 Algeria Algeria
|
79,665
|
0.95%
|
0.22%
|
—
|
| 31
|
 Netherlands Netherlands
|
75,830
|
0.91%
|
0.21%
|
—
|
| 32
|
 Egypt Egypt
|
73,705
|
0.88%
|
0.2%
|
—
|
| 33
|
 Bangladesh Bangladesh
|
70,090
|
0.84%
|
0.19%
|
—
|
| 34
|
 Taiwan Taiwan
|
65,360
|
0.78%
|
0.18%
|
—
|
| 35
|
 Trinidad and Tobago Trinidad and Tobago
|
65,040
|
0.78%
|
0.18%
|
—
|
| 36
|
 Afghanistan Afghanistan
|
62,455
|
0.75%
|
0.17%
|
—
|
| 37
|
 Greece Greece
|
54,715
|
0.65%
|
0.15%
|
—
|
| 38
|
 South Africa South Africa
|
51,590
|
0.62%
|
0.14%
|
—
|
| 39
|
 El Salvador El Salvador
|
49,445
|
0.59%
|
0.14%
|
—
|
| 40
|
 Brazil Brazil
|
48,450
|
0.58%
|
0.13%
|
—
|
| 41
|
 Ethiopia Ethiopia
|
41,715
|
0.5%
|
0.11%
|
—
|
| 42
|
 Croatia Croatia
|
36,680
|
0.44%
|
0.1%
|
—
|
| 43
|
 Bosnia and Herzegovina Bosnia and Herzegovina
|
35,925
|
0.43%
|
0.1%
|
—
|
| 44
|
 Turkey Turkey
|
35,270
|
0.42%
|
0.1%
|
—
|
| 45
|
 Democratic Republic of the Congo Democratic Republic of the Congo
|
33,115
|
0.4%
|
0.09%
|
—
|
| 46
|
 Somalia Somalia
|
32,500
|
0.39%
|
0.09%
|
—
|
| 47
|
 Serbia Serbia
|
31,925
|
0.38%
|
0.09%
|
Excludes Kosovo.
|
| 48
|
 Peru Peru
|
31,415
|
0.38%
|
0.09%
|
—
|
| 49
|
 Hungary Hungary
|
31,045
|
0.37%
|
0.09%
|
—
|
| 50
|
 Japan Japan
|
30,875
|
0.37%
|
0.08%
|
—
|
| 51
|
 Saudi Arabia Saudi Arabia
|
29,585
|
0.35%
|
0.08%
|
—
|
| 52
|
 United Arab Emirates United Arab Emirates
|
29,405
|
0.35%
|
0.08%
|
—
|
| 53
|
 Israel Israel
|
29,395
|
0.35%
|
0.08%
|
—
|
| 54
|
 Ireland Ireland
|
29,300
|
0.35%
|
0.08%
|
Also known as the Republic of Ireland
|
| 55
|
 Kenya Kenya
|
29,230
|
0.35%
|
0.08%
|
—
|
| 56
|
 Cameroon Cameroon
|
28,755
|
0.34%
|
0.08%
|
—
|
| 57
|
 Chile Chile
|
27,755
|
0.33%
|
0.08%
|
—
|
| 58
|
 Venezuela Venezuela
|
27,315
|
0.33%
|
0.08%
|
—
|
| 59
|
 Ghana Ghana
|
25,755
|
0.31%
|
0.07%
|
—
|
| 60
|
.svg.png) Australia Australia
|
25,200
|
0.3%
|
0.07%
|
Includes Norfolk Island.
|
| 61
|
 Malaysia Malaysia
|
25,060
|
0.3%
|
0.07%
|
—
|
| 62
|
 Fiji Fiji
|
24,715
|
0.3%
|
0.07%
|
—
|
| 63
|
 Tunisia Tunisia
|
24,425
|
0.29%
|
0.07%
|
—
|
| 64
|
 Cambodia Cambodia
|
23,070
|
0.28%
|
0.06%
|
—
|
| 65
|
 Tanzania Tanzania
|
21,595
|
0.26%
|
0.06%
|
—
|
| 66
|
 Moldova Moldova
|
20,070
|
0.24%
|
0.06%
|
—
|
| 67
|
 Cuba Cuba
|
19,545
|
0.23%
|
0.05%
|
—
|
| 68
|
 Czech Republic Czech Republic
|
19,545
|
0.23%
|
0.05%
|
—
|
| 69
|
 Argentina Argentina
|
19,530
|
0.23%
|
0.05%
|
—
|
| 70
|
 Nepal Nepal
|
19,375
|
0.23%
|
0.05%
|
—
|
| 71
|
 Bulgaria Bulgaria
|
19,170
|
0.23%
|
0.05%
|
—
|
| 72
|
 Ivory Coast Ivory Coast
|
18,860
|
0.23%
|
0.05%
|
—
|
| 73
|
.svg.png) Belgium Belgium
|
18,655
|
0.22%
|
0.05%
|
—
|
| 74
|
.svg.png) Switzerland Switzerland
|
18,190
|
0.22%
|
0.05%
|
—
|
| 75
|
 Mauritius Mauritius
|
18,140
|
0.22%
|
0.05%
|
—
|
| 76
|
 Guatemala Guatemala
|
18,030
|
0.22%
|
0.05%
|
—
|
| 77
|
 Albania Albania
|
17,825
|
0.21%
|
0.05%
|
—
|
| 78
|
 Kuwait Kuwait
|
17,655
|
0.21%
|
0.05%
|
—
|
| 79
|
 Jordan Jordan
|
17,525
|
0.21%
|
0.05%
|
—
|
| 80
|
 Thailand Thailand
|
17,415
|
0.21%
|
0.05%
|
—
|
| 81
|
 Ecuador Ecuador
|
16,320
|
0.2%
|
0.04%
|
—
|
| 82
|
 Indonesia Indonesia
|
16,025
|
0.19%
|
0.04%
|
—
|
| 83
|
 Sudan Sudan
|
16,025
|
0.19%
|
0.04%
|
—
|
| 84
|
 Uganda Uganda
|
15,120
|
0.18%
|
0.04%
|
—
|
| 85
|
 Kazakhstan Kazakhstan
|
13,965
|
0.17%
|
0.04%
|
—
|
| 86
|
 Laos Laos
|
13,955
|
0.17%
|
0.04%
|
—
|
| 87
|
 Saint Vincent and the Grenadines Saint Vincent and the Grenadines
|
13,935
|
0.17%
|
0.04%
|
—
|
| 88
|
 Austria Austria
|
13,835
|
0.17%
|
0.04%
|
—
|
| 89
|
 Barbados Barbados
|
13,665
|
0.16%
|
0.04%
|
—
|
| 90
|
 Dominican Republic Dominican Republic
|
13,360
|
0.16%
|
0.04%
|
—
|
| 91
|
 Burundi Burundi
|
13,050
|
0.16%
|
0.04%
|
—
|
| 93
|
 Singapore Singapore
|
12,560
|
0.15%
|
0.03%
|
—
|
| 94
|
 Belarus Belarus
|
12,190
|
0.15%
|
0.03%
|
—
|
| 95
|
 Zimbabwe Zimbabwe
|
12,050
|
0.14%
|
0.03%
|
—
|
| 96
|
 Spain Spain
|
11,510
|
0.14%
|
0.03%
|
—
|
| 97
|
 Denmark Denmark
|
11,000
|
0.13%
|
0.03%
|
—
|
| 98
|
 Nicaragua Nicaragua
|
10,730
|
0.13%
|
0.03%
|
—
|
| 99
|
 New Zealand New Zealand
|
10,675
|
0.13%
|
0.03%
|
—
|
| 100
|
 North Macedonia North Macedonia
|
10,195
|
0.12%
|
0.03%
|
—
|
| 101
|
 Senegal Senegal
|
10,045
|
0.12%
|
0.03%
|
—
|
| 102
|
 Grenada Grenada
|
9,895
|
0.12%
|
0.03%
|
—
|
| 103
|
 Myanmar Myanmar
|
9,230
|
0.11%
|
0.03%
|
—
|
| 104
|
.svg.png) Honduras Honduras
|
8,980
|
0.11%
|
0.02%
|
—
|
| 105
|
 Palestine (West Bank and Gaza Strip) Palestine (West Bank and Gaza Strip)
|
8,960
|
0.11%
|
0.02%
|
Recorded as "West Bank and Gaza Strip (Palestine)", since "Palestine" refers to pre-1948 British mandate Palestine. West Bank and Gaza Strip are the territories referred to in the Oslo I Accord, signed by Israel and the PLO in 1993.
|
| 106
|
 Kosovo Kosovo
|
8,445
|
0.1%
|
0.02%
|
—
|
| 107
|
 Finland Finland
|
8,420
|
0.1%
|
0.02%
|
—
|
| 108
|
 Libya Libya
|
8,300
|
0.1%
|
0.02%
|
—
|
| 109
|
 Rwanda Rwanda
|
7,950
|
0.1%
|
0.02%
|
—
|
| 110
|
 Uzbekistan Uzbekistan
|
7,075
|
0.08%
|
0.02%
|
—
|
| 111
|
 Slovenia Slovenia
|
6,935
|
0.08%
|
0.02%
|
—
|
| 112
|
 Saint Lucia Saint Lucia
|
6,730
|
0.08%
|
0.02%
|
—
|
| 113
|
 Sweden Sweden
|
6,680
|
0.08%
|
0.02%
|
—
|
| 114
|
 Uruguay Uruguay
|
6,435
|
0.08%
|
0.02%
|
—
|
| 115
|
 Malta Malta
|
6,305
|
0.08%
|
0.02%
|
—
|
| 116
|
 Guinea Guinea
|
6,205
|
0.07%
|
0.02%
|
—
|
| 117
|
 Paraguay Paraguay
|
6,080
|
0.07%
|
0.02%
|
—
|
| 118
|
 South Sudan South Sudan
|
5,995
|
0.07%
|
0.02%
|
—
|
| 119
|
 Macao Macao
|
5,320
|
0.06%
|
0.01%
|
—
|
| 120
|
 Azerbaijan Azerbaijan
|
5,205
|
0.06%
|
0.01%
|
—
|
| 121
|
 Latvia Latvia
|
5,075
|
0.06%
|
0.01%
|
—
|
| 122
|
 Armenia Armenia
|
5,065
|
0.06%
|
0.01%
|
—
|
| 123
|
 Lithuania Lithuania
|
4,930
|
0.06%
|
0.01%
|
—
|
| 124
|
.svg.png) Togo Togo
|
4,885
|
0.06%
|
0.01%
|
—
|
| 125
|
 Yemen Yemen
|
4,695
|
0.06%
|
0.01%
|
—
|
| 126
|
 Costa Rica Costa Rica
|
4,655
|
0.06%
|
0.01%
|
—
|
| 127
|
 Brunei Brunei
|
4,525
|
0.05%
|
0.01%
|
—
|
| 128
|
 Madagascar Madagascar
|
4,295
|
0.05%
|
0.01%
|
—
|
| 129
|
 Qatar Qatar
|
4,110
|
0.05%
|
0.01%
|
—
|
| 130
|
 Cyprus Cyprus
|
4,105
|
0.05%
|
0.01%
|
—
|
| 131
|
 Bhutan Bhutan
|
3,990
|
0.05%
|
0.01%
|
—
|
| 132
|
 Kyrgyzstan Kyrgyzstan
|
3,940
|
0.05%
|
0.01%
|
—
|
| 133
|
 Benin Benin
|
3,885
|
0.05%
|
0.01%
|
—
|
| 134
|
 Norway Norway
|
3,850
|
0.05%
|
0.01%
|
—
|
| 135
|
 Bolivia Bolivia
|
3,840
|
0.05%
|
0.01%
|
—
|
| 136
|
 Angola Angola
|
3,510
|
0.04%
|
0.01%
|
—
|
| 137
|
 Zambia Zambia
|
3,475
|
0.04%
|
0.01%
|
—
|
| 138
|
 Georgia Georgia
|
3,305
|
0.04%
|
0.01%
|
—
|
| 139
|
 Djibouti Djibouti
|
3,245
|
0.04%
|
0.01%
|
—
|
| 140
|
 Sierra Leone Sierra Leone
|
3,120
|
0.04%
|
0.01%
|
—
|
| 141
|
 Republic of the Congo Republic of the Congo
|
3,070
|
0.04%
|
0.01%
|
—
|
| 142
|
 Burkina Faso Burkina Faso
|
2,935
|
0.04%
|
0.01%
|
—
|
| 143
|
 Dominica Dominica
|
2,900
|
0.03%
|
0.01%
|
—
|
| 144
|
 Mali Mali
|
2,835
|
0.03%
|
0.01%
|
—
|
| 145
|
 Bahrain Bahrain
|
2,810
|
0.03%
|
0.01%
|
—
|
| 146
|
 Panama Panama
|
2,805
|
0.03%
|
0.01%
|
—
|
| 147
|
 Liberia Liberia
|
2,645
|
0.03%
|
0.01%
|
—
|
| 148
|
 Estonia Estonia
|
2,600
|
0.03%
|
0.01%
|
—
|
| 149
|
 Antigua and Barbuda Antigua and Barbuda
|
2,435
|
0.03%
|
0.01%
|
—
|
| 150
|
 Oman Oman
|
2,240
|
0.03%
|
0.01%
|
—
|
| —
|
Total immigrants
|
8,361,505
|
100%
|
23.02%
|
—
|
2016 census
The 2016 census reported that immigrants comprised 7,540,830 individuals or 21.9 percent of the total Canadian population. Of the total immigrant population, the top countries of origin were India (668,565 persons or 8.9%), China (649,260 persons or 8.6%), Philippines (588,305 persons or 7.8%), United Kingdom (499,120 persons or 6.6%), United States (253,715 persons or 3.4%), Italy (236,635 persons or 3.1%), Hong Kong (208,935 persons or 2.8%), Pakistan (202,255 persons or 2.7%), Vietnam (169,250 persons or 2.2%), and Iran (154,420 persons or 2.1%).[20]
Total immigrant population by country of birth, 2016 Canadian census[20]
Immigrant refers to all those who hold or have ever held permanent resident status in Canada, including naturalized citizens.
| Rank
|
Country of birth
|
Immigrant population
|
Proportion of immigrants in Canada
|
Proportion of Canadian population
|
Notes
|
| —
|
Canada
|
7,540,830
|
100%
|
21.88%
|
—
|
| 1
|
India
|
668,565
|
8.87%
|
1.94%
|
—
|
| 2
|
China
|
649,260
|
8.61%
|
1.88%
|
Officially the People's Republic of China. Excludes Hong Kong and Macau (included in this table below).
|
| 3
|
Philippines
|
588,305
|
7.8%
|
1.71%
|
—
|
| 4
|
United Kingdom
|
499,120
|
6.62%
|
1.45%
|
Officially the United Kingdom of Great Britain and Northern Ireland. Includes Scotland, Wales, England and Northern Ireland. Excludes Isle of Man, the Channel Islands, and British Overseas Territories.
|
| 5
|
United States
|
253,715
|
3.36%
|
0.74%
|
—
|
| 6
|
Italy
|
236,635
|
3.14%
|
0.69%
|
—
|
| 7
|
Hong Kong
|
208,935
|
2.77%
|
0.61%
|
Officially the Hong Kong Special Administrative Region of China.
|
| 8
|
Pakistan
|
202,255
|
2.68%
|
0.59%
|
—
|
| 9
|
Vietnam
|
169,250
|
2.24%
|
0.49%
|
Many from the former Republic of Vietnam
|
| 10
|
Iran
|
154,420
|
2.05%
|
0.45%
|
—
|
| 11
|
Poland
|
146,470
|
1.94%
|
0.43%
|
—
|
| 12
|
Germany
|
145,840
|
1.93%
|
0.42%
|
—
|
| 13
|
Portugal
|
139,450
|
1.85%
|
0.4%
|
—
|
| 14
|
Jamaica
|
138,345
|
1.83%
|
0.4%
|
—
|
| 15
|
Sri Lanka
|
131,995
|
1.75%
|
0.38%
|
—
|
| 16
|
Korea, South
|
123,305
|
1.64%
|
0.36%
|
Officially the Republic of Korea.
|
| 17
|
France
|
105,570
|
1.4%
|
0.31%
|
—
|
| 18
|
Haiti
|
93,485
|
1.24%
|
0.27%
|
—
|
| 19
|
Romania
|
90,310
|
1.2%
|
0.26%
|
—
|
| 20
|
Lebanon
|
88,740
|
1.18%
|
0.26%
|
—
|
| 21
|
Netherlands
|
88,475
|
1.17%
|
0.26%
|
—
|
| 22
|
Guyana
|
87,680
|
1.16%
|
0.25%
|
—
|
| 23
|
Mexico
|
80,590
|
1.07%
|
0.23%
|
—
|
| 24
|
Russia
|
78,685
|
1.04%
|
0.23%
|
—
|
| 25
|
Ukraine
|
73,030
|
0.97%
|
0.21%
|
—
|
| 26
|
Colombia
|
70,040
|
0.93%
|
0.2%
|
—
|
| 27
|
Morocco
|
69,655
|
0.92%
|
0.2%
|
—
|
| 28
|
Iraq
|
68,490
|
0.91%
|
0.2%
|
—
|
| 29
|
Trinidad and Tobago
|
65,035
|
0.86%
|
0.19%
|
—
|
| 30
|
Algeria
|
64,625
|
0.86%
|
0.19%
|
—
|
| 31
|
Egypt
|
64,620
|
0.86%
|
0.19%
|
—
|
| 32
|
Taiwan
|
63,770
|
0.85%
|
0.19%
|
—
|
| 33
|
Greece
|
62,715
|
0.83%
|
0.18%
|
—
|
| 34
|
Bangladesh
|
58,735
|
0.78%
|
0.17%
|
—
|
| 35
|
Syria
|
52,955
|
0.7%
|
0.15%
|
—
|
| 36
|
Afghanistan
|
51,960
|
0.69%
|
0.15%
|
—
|
| 37
|
El Salvador
|
48,075
|
0.64%
|
0.14%
|
—
|
| 38
|
South Africa
|
44,660
|
0.59%
|
0.13%
|
—
|
| 39
|
Nigeria
|
42,430
|
0.56%
|
0.12%
|
—
|
| 40
|
Croatia
|
40,040
|
0.53%
|
0.12%
|
—
|
| 41
|
Hungary
|
36,825
|
0.49%
|
0.11%
|
—
|
| 42
|
Bosnia and Herzegovina
|
36,135
|
0.48%
|
0.1%
|
—
|
| 43
|
Serbia
|
33,320
|
0.44%
|
0.1%
|
Excludes Kosovo.
|
| 44
|
Ethiopia
|
32,790
|
0.43%
|
0.1%
|
—
|
| 45
|
Peru
|
29,615
|
0.39%
|
0.09%
|
—
|
| 46
|
Brazil
|
29,315
|
0.39%
|
0.09%
|
—
|
| 47
|
Ireland
|
28,320
|
0.38%
|
0.08%
|
Also known as the Republic of Ireland
|
| 48
|
Japan
|
27,245
|
0.36%
|
0.08%
|
—
|
| 49
|
Somalia
|
27,230
|
0.36%
|
0.08%
|
—
|
| 50
|
Kenya
|
27,150
|
0.36%
|
0.08%
|
—
|
| 51
|
Israel
|
26,735
|
0.35%
|
0.08%
|
—
|
| 52
|
Turkey
|
26,710
|
0.35%
|
0.08%
|
—
|
| 53
|
Chile
|
26,705
|
0.35%
|
0.08%
|
—
|
| 54
|
Congo, Democratic Republic of the
|
25,655
|
0.34%
|
0.07%
|
—
|
| 55
|
Fiji
|
24,660
|
0.33%
|
0.07%
|
—
|
| 56
|
Malaysia
|
23,785
|
0.32%
|
0.07%
|
—
|
| 57
|
Cambodia
|
23,320
|
0.31%
|
0.07%
|
—
|
| 58
|
Ghana
|
22,910
|
0.3%
|
0.07%
|
—
|
| 59
|
Australia
|
21,115
|
0.28%
|
0.06%
|
Includes Norfolk Island.
|
| 60
|
Czech Republic
|
21,065
|
0.28%
|
0.06%
|
—
|
| 61
|
United Arab Emirates
|
20,990
|
0.28%
|
0.06%
|
—
|
| 62
|
Venezuela
|
20,775
|
0.28%
|
0.06%
|
—
|
| 63
|
Tanzania
|
20,600
|
0.27%
|
0.06%
|
—
|
| 64
|
Saudi Arabia
|
20,080
|
0.27%
|
0.06%
|
—
|
| 65
|
Argentina
|
19,430
|
0.26%
|
0.06%
|
—
|
| 66
|
Switzerland
|
19,040
|
0.25%
|
0.06%
|
—
|
| 67
|
Belgium
|
18,935
|
0.25%
|
0.05%
|
—
|
| 68
|
Bulgaria
|
18,635
|
0.25%
|
0.05%
|
—
|
| 69
|
Cameroon
|
18,570
|
0.25%
|
0.05%
|
—
|
| 70
|
Cuba
|
17,850
|
0.24%
|
0.05%
|
—
|
| 71
|
Moldova
|
17,605
|
0.23%
|
0.05%
|
—
|
| 72
|
Tunisia
|
17,435
|
0.23%
|
0.05%
|
—
|
| 73
|
Guatemala
|
17,275
|
0.23%
|
0.05%
|
—
|
| 74
|
Mauritius
|
15,900
|
0.21%
|
0.05%
|
—
|
| 75
|
Austria
|
15,845
|
0.21%
|
0.05%
|
—
|
| 76
|
Albania
|
15,365
|
0.2%
|
0.04%
|
—
|
| 77
|
Kuwait
|
15,235
|
0.2%
|
0.04%
|
—
|
| 78
|
Thailand
|
15,075
|
0.2%
|
0.04%
|
—
|
| 79
|
 Eritrea Eritrea
|
15,010
|
0.2%
|
0.04%
|
—
|
| 80
|
Ecuador
|
14,965
|
0.2%
|
0.04%
|
—
|
| 81
|
Laos
|
14,475
|
0.19%
|
0.04%
|
—
|
| 82
|
 Slovakia Slovakia
|
14,410
|
0.19%
|
0.04%
|
—
|
| 83
|
Nepal
|
14,390
|
0.19%
|
0.04%
|
—
|
| 84
|
Indonesia
|
14,280
|
0.19%
|
0.04%
|
—
|
| 85
|
Barbados
|
14,095
|
0.19%
|
0.04%
|
—
|
| 86
|
Jordan
|
13,295
|
0.18%
|
0.04%
|
—
|
| 87
|
Uganda
|
13,210
|
0.18%
|
0.04%
|
—
|
| 88
|
St. Vincent and the Grenadines
|
12,945
|
0.17%
|
0.04%
|
—
|
| 89
|
Denmark
|
12,515
|
0.17%
|
0.04%
|
—
|
| 90
|
Kazakhstan
|
12,450
|
0.17%
|
0.04%
|
—
|
| 91
|
Singapore
|
11,820
|
0.16%
|
0.03%
|
—
|
| 92
|
Ivory Coast
|
11,325
|
0.15%
|
0.03%
|
Also known as Côte d'Ivoire.
|
| 93
|
Belarus
|
11,190
|
0.15%
|
0.03%
|
—
|
| 94
|
Sudan
|
10,820
|
0.14%
|
0.03%
|
—
|
| 95
|
Spain
|
10,700
|
0.14%
|
0.03%
|
—
|
| 96
|
Dominican Republic
|
10,605
|
0.14%
|
0.03%
|
—
|
| 97
|
Zimbabwe
|
10,495
|
0.14%
|
0.03%
|
—
|
| 98
|
North Macedonia
|
10,300
|
0.14%
|
0.03%
|
Officially the Republic of North Macedonia. Also known as the former Yugoslav Republic of Macedonia by the United Nations and other international bodies.
|
| 99
|
Grenada
|
10,265
|
0.14%
|
0.03%
|
—
|
| 100
|
New Zealand
|
9,880
|
0.13%
|
0.03%
|
Includes Niue and Tokelau.
|
| 101
|
Nicaragua
|
9,865
|
0.13%
|
0.03%
|
—
|
| 102
|
Finland
|
9,525
|
0.13%
|
0.03%
|
—
|
| 103
|
Burundi
|
8,470
|
0.11%
|
0.02%
|
—
|
| 104
|
Myanmar
|
8,215
|
0.11%
|
0.02%
|
Also known as Burma.
|
| 105
|
Slovenia
|
8,210
|
0.11%
|
0.02%
|
—
|
| 106
|
Palestine, West Bank and Gaza Strip
|
8,210
|
0.11%
|
0.02%
|
Recorded as "West Bank and Gaza Strip (Palestine)", since "Palestine" refers to pre-1948 British mandate Palestine. West Bank and Gaza Strip are the territories referred to in the Oslo I Accord, signed by Israel and the PLO in 1993.
|
| 107
|
Honduras
|
7,790
|
0.1%
|
0.02%
|
—
|
| 108
|
Kosovo
|
7,610
|
0.1%
|
0.02%
|
—
|
| 109
|
Senegal
|
7,515
|
0.1%
|
0.02%
|
—
|
| 110
|
Malta
|
7,465
|
0.1%
|
0.02%
|
—
|
| 111
|
Paraguay
|
7,305
|
0.1%
|
0.02%
|
—
|
| 112
|
Sweden
|
6,630
|
0.09%
|
0.02%
|
—
|
| 113
|
Uruguay
|
6,535
|
0.09%
|
0.02%
|
—
|
| 114
|
Uzbekistan
|
6,385
|
0.08%
|
0.02%
|
—
|
| 115
|
Libya
|
6,300
|
0.08%
|
0.02%
|
—
|
| 116
|
Rwanda
|
6,105
|
0.08%
|
0.02%
|
—
|
| 117
|
St. Lucia
|
6,100
|
0.08%
|
0.02%
|
—
|
| 118
|
Latvia
|
5,875
|
0.08%
|
0.02%
|
—
|
| 119
|
Macau
|
5,750
|
0.08%
|
0.02%
|
Officially the Macao Special Administrative Region of China.
|
| 120
|
South Sudan
|
5,540
|
0.07%
|
0.02%
|
—
|
| 121
|
Guinea
|
5,190
|
0.07%
|
0.02%
|
—
|
| 122
|
Lithuania
|
4,980
|
0.07%
|
0.01%
|
—
|
| 123
|
Brunei
|
4,485
|
0.06%
|
0.01%
|
—
|
| 124
|
Bolivia
|
4,400
|
0.06%
|
0.01%
|
—
|
| 125
|
Bhutan
|
4,250
|
0.06%
|
0.01%
|
—
|
| 126
|
Armenia
|
4,165
|
0.06%
|
0.01%
|
—
|
| 127
|
Cyprus
|
4,020
|
0.05%
|
0.01%
|
—
|
| 128
|
Costa Rica
|
3,950
|
0.05%
|
0.01%
|
—
|
| 129
|
Norway
|
3,885
|
0.05%
|
0.01%
|
—
|
| 130
|
Azerbaijan
|
3,845
|
0.05%
|
0.01%
|
—
|
| 131
|
Zambia
|
3,715
|
0.05%
|
0.01%
|
—
|
| 132
|
Madagascar
|
3,555
|
0.05%
|
0.01%
|
—
|
| 133
|
Togo
|
3,350
|
0.04%
|
0.01%
|
—
|
| 134
|
Estonia
|
3,200
|
0.04%
|
0.01%
|
—
|
| 135
|
Angola
|
3,120
|
0.04%
|
0.01%
|
—
|
| 136
|
Sierra Leone
|
3,040
|
0.04%
|
0.01%
|
—
|
| 137
|
Kyrgyzstan
|
2,980
|
0.04%
|
0.01%
|
—
|
| 138
|
Yemen
|
2,960
|
0.04%
|
0.01%
|
—
|
| 139
|
Dominica
|
2,775
|
0.04%
|
0.01%
|
—
|
| 140
|
Benin
|
2,760
|
0.04%
|
0.01%
|
—
|
| 141
|
Panama
|
2,620
|
0.03%
|
0.01%
|
—
|
| 142
|
Georgia
|
2,570
|
0.03%
|
0.01%
|
—
|
| 143
|
Qatar
|
2,485
|
0.03%
|
0.01%
|
—
|
| 144
|
Liberia
|
2,480
|
0.03%
|
0.01%
|
—
|
| 145
|
Republic of the Congo
|
2,460
|
0.03%
|
0.01%
|
—
|
| 146
|
Bahrain
|
2,390
|
0.03%
|
0.01%
|
—
|
| 147
|
Antigua and Barbuda
|
2,310
|
0.03%
|
0.01%
|
—
|
| 148
|
Djibouti
|
2,235
|
0.03%
|
0.01%
|
—
|
| 149
|
 Saint Kitts and Nevis Saint Kitts and Nevis
|
2,105
|
0.03%
|
0.01%
|
—
|
| 150
|
Mali
|
2,095
|
0.03%
|
0.01%
|
—
|
| 151
|
 Belize Belize
|
1,995
|
0.03%
|
0.01%
|
—
|
| 152
|
Burkina Faso
|
1,980
|
0.03%
|
0.01%
|
—
|
| 153
|
 Montenegro Montenegro
|
1,865
|
0.02%
|
0.01%
|
—
|
| 154
|
 Bermuda Bermuda
|
1,845
|
0.02%
|
0.01%
|
—
|
| 155
|
 Bahamas Bahamas
|
1,635
|
0.02%
|
0%
|
—
|
| 156
|
 Chad Chad
|
1,595
|
0.02%
|
0%
|
—
|
| 157
|
Oman
|
1,540
|
0.02%
|
0%
|
—
|
| 158
|
 Mongolia Mongolia
|
1,420
|
0.02%
|
0%
|
—
|
| 159
|
 Tajikistan Tajikistan
|
1,310
|
0.02%
|
0%
|
—
|
| 160
|
 Mozambique Mozambique
|
1,255
|
0.02%
|
0%
|
—
|
| 161
|
 Gabon Gabon
|
1,080
|
0.01%
|
0%
|
—
|
| 162
|
 Central African Republic Central African Republic
|
1,055
|
0.01%
|
0%
|
—
|
| 163
|
 Suriname Suriname
|
1,050
|
0.01%
|
0%
|
—
|
| 164
|
 Namibia Namibia
|
1,035
|
0.01%
|
0%
|
—
|
| 164
|
Others
|
1,035
|
0.01%
|
0%
|
Includes a small number of immigrants who were born in Canada, as well as other places of birth not included elsewhere (e.g. 'born at sea').
|
| 164
|
 Seychelles Seychelles
|
1,035
|
0.01%
|
0%
|
—
|
| 167
|
 Niger Niger
|
1,030
|
0.01%
|
0%
|
—
|
| 168
|
 Mauritania Mauritania
|
905
|
0.01%
|
0%
|
—
|
| 169
|
 Botswana Botswana
|
850
|
0.01%
|
0%
|
—
|
| 170
|
 North Korea North Korea
|
780
|
0.01%
|
0%
|
Officially the Democratic People's Republic of Korea.
|
| 171
|
 Luxembourg Luxembourg
|
675
|
0.01%
|
0%
|
—
|
| 172
|
 Malawi Malawi
|
670
|
0.01%
|
0%
|
—
|
| 173
|
 Gambia Gambia
|
665
|
0.01%
|
0%
|
—
|
| 174
|
 Martinique Martinique
|
640
|
0.01%
|
0%
|
—
|
| 175
|
 Montserrat Montserrat
|
610
|
0.01%
|
0%
|
—
|
| 176
|
 Iceland Iceland
|
590
|
0.01%
|
0%
|
—
|
| 177
|
 Aruba Aruba
|
580
|
0.01%
|
0%
|
—
|
| 178
|
Guadeloupe
|
515
|
0.01%
|
0%
|
—
|
| 179
|
 Puerto Rico Puerto Rico
|
505
|
0.01%
|
0%
|
—
|
| 180
|
 Turkmenistan Turkmenistan
|
500
|
0.01%
|
0%
|
—
|
| 181
|
 Curaçao Curaçao
|
470
|
0.01%
|
0%
|
—
|
| 182
|
 Isle of Man Isle of Man
|
415
|
0.01%
|
0%
|
—
|
| 183
|
 Eswatini Eswatini
|
400
|
0.01%
|
0%
|
—
|
| 184
|
 Jersey Jersey
|
360
|
0%
|
0%
|
—
|
| 185
|
Réunion
|
295
|
0%
|
0%
|
—
|
| 186
|
Saint Pierre and Miquelon
|
290
|
0%
|
0%
|
—
|
| 187
|
French Guiana
|
280
|
0%
|
0%
|
—
|
| 188
|
 Cayman Islands Cayman Islands
|
270
|
0%
|
0%
|
—
|
| 189
|
 Papua New Guinea Papua New Guinea
|
235
|
0%
|
0%
|
—
|
| 190
|
 New Caledonia New Caledonia
|
220
|
0%
|
0%
|
—
|
| 191
|
 Guernsey Guernsey
|
195
|
0%
|
0%
|
—
|
| 192
|
 French Polynesia French Polynesia
|
185
|
0%
|
0%
|
—
|
| 192
|
 Sint Maarten Sint Maarten
|
185
|
0%
|
0%
|
Part of the Kingdom of the Netherlands.
|
| 194
|
 Cape Verde Cape Verde
|
170
|
0%
|
0%
|
—
|
| 195
|
 Gibraltar Gibraltar
|
160
|
0%
|
0%
|
—
|
| 196
|
 Samoa Samoa
|
155
|
0%
|
0%
|
—
|
| 197
|
 Comoros Comoros
|
140
|
0%
|
0%
|
—
|
| 197
|
 Tonga Tonga
|
140
|
0%
|
0%
|
—
|
| 199
|
 Northern Mariana Islands Northern Mariana Islands
|
120
|
0%
|
0%
|
—
|
| 200
|
 Guinea-Bissau Guinea-Bissau
|
110
|
0%
|
0%
|
—
|
| 200
|
 Monaco Monaco
|
110
|
0%
|
0%
|
—
|
| 202
|
 Lesotho Lesotho
|
105
|
0%
|
0%
|
—
|
| 203
|
 United States Virgin Islands United States Virgin Islands
|
90
|
0%
|
0%
|
—
|
| 204
|
 British Virgin Islands British Virgin Islands
|
85
|
0%
|
0%
|
—
|
| 205
|
 Liechtenstein Liechtenstein
|
65
|
0%
|
0%
|
—
|
| 206
|
 Anguilla Anguilla
|
60
|
0%
|
0%
|
—
|
| 206
|
 Equatorial Guinea Equatorial Guinea
|
60
|
0%
|
0%
|
—
|
| 206
|
 Turks and Caicos Islands Turks and Caicos Islands
|
60
|
0%
|
0%
|
—
|
| 209
|
 Greenland Greenland
|
55
|
0%
|
0%
|
—
|
| 210
|
 Maldives Maldives
|
50
|
0%
|
0%
|
—
|
| 211
|
 Solomon Islands Solomon Islands
|
40
|
0%
|
0%
|
—
|
| 212
|
 Faroe Islands Faroe Islands
|
35
|
0%
|
0%
|
—
|
| 213
|
 Guam Guam
|
30
|
0%
|
0%
|
—
|
| 213
|
 Palau Palau
|
30
|
0%
|
0%
|
—
|
| 213
|
 Vanuatu Vanuatu
|
30
|
0%
|
0%
|
—
|
| 216
|
 Bonaire Bonaire
|
25
|
0%
|
0%
|
—
|
| 216
|
 Nauru Nauru
|
25
|
0%
|
0%
|
—
|
| 216
|
 São Tomé and Príncipe São Tomé and Príncipe
|
25
|
0%
|
0%
|
—
|
| 216
|
 East Timor East Timor
|
25
|
0%
|
0%
|
Also known as Timor-Leste.
|
| 220
|
 Andorra Andorra
|
20
|
0%
|
0%
|
—
|
| 220
|
 Kiribati Kiribati
|
20
|
0%
|
0%
|
—
|
| 220
|
 Marshall Islands Marshall Islands
|
20
|
0%
|
0%
|
—
|
| 223
|
 Falkland Islands Falkland Islands
|
10
|
0%
|
0%
|
—
|
| 223
|
 Micronesia Micronesia
|
10
|
0%
|
0%
|
—
|
| 223
|
Saint Barthélemy
|
10
|
0%
|
0%
|
—
|
| 223
|
 Saint Helena Saint Helena
|
10
|
0%
|
0%
|
Officially Saint Helena, Ascension and Tristan da Cunha.
|
| 223
|
Wallis and Futuna
|
10
|
0%
|
0%
|
—
|
| 223
|
 Åland Islands Åland Islands
|
10
|
0%
|
0%
|
—
|
| —
|
Total immigrants
|
7,540,830
|
100%
|
21.88%
|
—
|
2011 census
The 2011 census reported that immigrants comprised 6,775,765 individuals or 20.6 percent of the total Canadian population. Of the total immigrant population, the top countries of origin were India (547,890 persons or 8.1 percent), China (545,535 5persons or 8.1 percent), United Kingdom (537,040 persons or 7.9 percent), Philippines (454,340 persons or 6.7 percent), United States (263,475 persons or 3.9 percent), Italy (256,825 persons or 3.8 percent), Hong Kong (205,430 persons or 3.0 percent), Vietnam (165,125 persons or 2.5 percent), Pakistan (156,860 persons or 2.3 percent), and Germany (152,345 persons or 2.3 percent).[21][22][23]
Total immigrant population by country of birth, 2011 Canadian census[21][22][23]
Immigrant refers to all those who hold or have ever held permanent resident status in Canada, including naturalized citizens.
| Rank
|
Country of birth
|
Immigrant population
|
Proportion of immigrants in Canada
|
Proportion of Canadian population
|
Notes
|
| —
|
Canada
|
6,775,765
|
100%
|
20.62%
|
—
|
| 1
|
India
|
547,890
|
8.09%
|
1.67%
|
—
|
| 2
|
China
|
545,535
|
8.05%
|
1.66%
|
Officially the People's Republic of China. Excludes Hong Kong and Macau (included in this table below).
|
| 3
|
United Kingdom
|
537,040
|
7.93%
|
1.63%
|
Officially the United Kingdom of Great Britain and Northern Ireland. Includes Scotland, Wales, England and Northern Ireland. Excludes Isle of Man, the Channel Islands, and British Overseas Territories.
|
| 4
|
Philippines
|
454,340
|
6.71%
|
1.38%
|
—
|
| 5
|
United States
|
263,475
|
3.89%
|
0.8%
|
—
|
| 6
|
Italy
|
256,825
|
3.79%
|
0.78%
|
—
|
| 7
|
Hong Kong
|
205,430
|
3.03%
|
0.63%
|
Officially the Hong Kong Special Administrative Region of China.
|
| 8
|
Vietnam
|
165,125
|
2.44%
|
0.5%
|
Many from the former Republic of Vietnam
|
| 9
|
Pakistan
|
156,860
|
2.32%
|
0.48%
|
—
|
| 10
|
Germany
|
152,345
|
2.25%
|
0.46%
|
—
|
| 11
|
Poland
|
152,290
|
2.25%
|
0.46%
|
—
|
| 12
|
Portugal
|
138,520
|
2.04%
|
0.42%
|
—
|
| 13
|
Sri Lanka
|
132,130
|
1.95%
|
0.4%
|
—
|
| 14
|
Jamaica
|
126,035
|
1.86%
|
0.38%
|
—
|
| 15
|
Iran
|
120,685
|
1.78%
|
0.37%
|
—
|
| 16
|
South Korea
|
112,400
|
1.66%
|
0.34%
|
Officially the Republic of Korea.
|
| 17
|
Netherlands
|
98,510
|
1.45%
|
0.3%
|
—
|
| 18
|
France
|
90,440
|
1.33%
|
0.28%
|
—
|
| 19
|
Guyana
|
87,945
|
1.3%
|
0.27%
|
—
|
| 20
|
Haiti
|
80,100
|
1.18%
|
0.24%
|
—
|
| 21
|
Mexico
|
69,695
|
1.03%
|
0.21%
|
|
| 22
|
Romania
|
82,595
|
1.22%
|
0.25%
|
—
|
| 23
|
Lebanon
|
81,105
|
1.2%
|
0.25%
|
—
|
| 24
|
Russia
|
73,030
|
1.08%
|
0.22%
|
—
|
| 25
|
Trinidad and Tobago
|
67,205
|
0.99%
|
0.2%
|
—
|
| 26
|
Taiwan
|
66,455
|
0.98%
|
0.2%
|
—
|
| 27
|
Greece
|
66,475
|
0.98%
|
0.2%
|
—
|
| 28
|
Ukraine
|
65,455
|
0.97%
|
0.2%
|
—
|
| 29
|
Colombia
|
60,555
|
0.89%
|
0.18%
|
—
|
| 30
|
Morocco
|
56,275
|
0.83%
|
0.17%
|
—
|
| 31
|
Algeria
|
51,085
|
0.75%
|
0.16%
|
—
|
| 32
|
Egypt
|
49,935
|
0.74%
|
0.15%
|
—
|
| 33
|
Iraq
|
49,515
|
0.73%
|
0.15%
|
—
|
| 34
|
Bangladesh
|
45,320
|
0.67%
|
0.14%
|
—
|
| 35
|
El Salvador
|
43,655
|
0.64%
|
0.13%
|
—
|
| 36
|
South Africa
|
40,550
|
0.6%
|
0.12%
|
—
|
| 37
|
Afghanistan
|
40,945
|
0.6%
|
0.12%
|
—
|
| 38
|
Croatia
|
40,010
|
0.59%
|
0.12%
|
—
|
| 39
|
Hungary
|
38,985
|
0.58%
|
0.12%
|
—
|
| 40
|
Bosnia and Herzegovina
|
35,885
|
0.53%
|
0.11%
|
—
|
| 41
|
Serbia
|
32,600
|
0.48%
|
0.1%
|
Excludes Kosovo.
|
| 42
|
Nigeria
|
27,625
|
0.41%
|
0.08%
|
—
|
| 43
|
Ireland
|
28,040
|
0.41%
|
0.09%
|
Also known as the Republic of Ireland
|
| 44
|
Peru
|
26,715
|
0.39%
|
0.08%
|
—
|
| 45
|
Japan
|
25,805
|
0.38%
|
0.08%
|
—
|
| 46
|
Brazil
|
24,660
|
0.36%
|
0.08%
|
—
|
| 47
|
Ethiopia
|
24,535
|
0.36%
|
0.07%
|
—
|
| 48
|
Kenya
|
24,510
|
0.36%
|
0.07%
|
—
|
| 49
|
Somalia
|
22,800
|
0.34%
|
0.07%
|
—
|
| 50
|
Syria
|
22,725
|
0.34%
|
0.07%
|
—
|
| —
|
Total immigrants
|
6,775,765
|
100%
|
20.62%
|
—
|
2006 census
The 2006 census reported that immigrants comprised 6,186,950 individuals or 19.8 percent of the total Canadian population. Of the total immigrant population, the top countries of origin were United Kingdom (579,620 persons or 9.4%), China (466,940 persons or 7.6%), India (443,690 persons or 7.2%), Philippines (303,195 persons or 4.9%), Italy (296,850 persons or 4.8%), United States (250,535 persons or 4.1%), Hong Kong (215,430 persons or 3.5%), Germany (171,405 persons or 2.8%), Poland (170,490 persons or 2.8%), and Vietnam (160,170 persons or 2.6%).[24][25][26]
Total immigrant population by country of birth, 2006 Canadian census[24][25][26]
Immigrant refers to all those who hold or have ever held permanent resident status in Canada, including naturalized citizens.
| Rank
|
Country of birth
|
Immigrant population
|
Proportion of immigrants in Canada
|
Proportion of Canadian population
|
Notes
|
| —
|
Canada
|
6,186,950
|
100%
|
19.8%
|
—
|
| 1
|
United Kingdom
|
579,620
|
9.37%
|
1.86%
|
Officially the United Kingdom of Great Britain and Northern Ireland. Includes Scotland, Wales, England and Northern Ireland. Excludes Isle of Man, the Channel Islands, and British Overseas Territories.
|
| 2
|
China
|
466,940
|
7.55%
|
1.49%
|
Officially the People's Republic of China. Excludes Hong Kong and Macau (included in this table below).
|
| 3
|
India
|
443,690
|
7.17%
|
1.42%
|
—
|
| 4
|
Philippines
|
303,195
|
4.9%
|
0.97%
|
—
|
| 5
|
Italy
|
296,850
|
4.8%
|
0.95%
|
—
|
| 6
|
United States
|
250,535
|
4.05%
|
0.8%
|
—
|
| 7
|
Hong Kong
|
215,430
|
3.48%
|
0.69%
|
Officially the Hong Kong Special Administrative Region of China.
|
| 8
|
Germany
|
171,405
|
2.77%
|
0.55%
|
—
|
| 9
|
Poland
|
170,490
|
2.76%
|
0.55%
|
—
|
| 10
|
Vietnam
|
160,170
|
2.59%
|
0.51%
|
Many from the former Republic of Vietnam
|
| 11
|
Portugal
|
150,390
|
2.43%
|
0.48%
|
—
|
| 12
|
Pakistan
|
133,280
|
2.15%
|
0.43%
|
—
|
| 13
|
Jamaica
|
123,420
|
1.99%
|
0.4%
|
—
|
| 14
|
Netherlands
|
111,990
|
1.81%
|
0.36%
|
—
|
| 15
|
Sri Lanka
|
105,670
|
1.71%
|
0.34%
|
—
|
| 16
|
South Korea
|
98,395
|
1.59%
|
0.31%
|
Officially the Republic of Korea.
|
| 17
|
Iran
|
92,090
|
1.49%
|
0.29%
|
—
|
| 18
|
Guyana
|
87,195
|
1.41%
|
0.28%
|
—
|
| 19
|
Romania
|
82,645
|
1.34%
|
0.26%
|
—
|
| 20
|
France
|
79,550
|
1.29%
|
0.25%
|
—
|
| 21
|
Lebanon
|
75,275
|
1.22%
|
0.24%
|
—
|
| 22
|
Greece
|
73,125
|
1.18%
|
0.23%
|
—
|
| 23
|
Trinidad and Tobago
|
65,540
|
1.06%
|
0.21%
|
—
|
| 24
|
Taiwan
|
65,205
|
1.05%
|
0.21%
|
—
|
| 25
|
Russia
|
64,130
|
1.04%
|
0.21%
|
—
|
| 26
|
Haiti
|
63,350
|
1.02%
|
0.2%
|
—
|
| 27
|
Ukraine
|
59,460
|
0.96%
|
0.19%
|
—
|
| 28
|
Mexico
|
49,925
|
0.81%
|
0.16%
|
—
|
| 29
|
Hungary
|
45,940
|
0.74%
|
0.15%
|
—
|
| 30
|
El Salvador
|
42,780
|
0.69%
|
0.14%
|
—
|
| 31
|
Egypt
|
40,575
|
0.66%
|
0.13%
|
—
|
| 32
|
Croatia
|
39,250
|
0.63%
|
0.13%
|
—
|
| 33
|
Colombia
|
39,145
|
0.63%
|
0.13%
|
—
|
| 34
|
Morocco
|
39,055
|
0.63%
|
0.13%
|
—
|
| 35
|
South Africa
|
38,305
|
0.62%
|
0.12%
|
—
|
| 36
|
.svg.png) Yugoslavia n.o.s. Yugoslavia n.o.s.
|
37,205
|
0.6%
|
0.12%
|
The abbreviation 'n.o.s.' means 'not otherwise specified.'
|
| 37
|
Afghanistan
|
36,165
|
0.58%
|
0.12%
|
—
|
| 38
|
Iraq
|
33,545
|
0.54%
|
0.11%
|
—
|
| 39
|
Bangladesh
|
33,230
|
0.54%
|
0.11%
|
—
|
| 40
|
Algeria
|
32,255
|
0.52%
|
0.1%
|
—
|
| 41
|
Bosnia and Herzegovina
|
28,730
|
0.46%
|
0.09%
|
—
|
| 42
|
Chile
|
26,505
|
0.43%
|
0.08%
|
—
|
| 43
|
.svg.png) Serbia and Montenegro Serbia and Montenegro
|
25,465
|
0.41%
|
0.08%
|
—
|
| 44
|
Fiji
|
24,390
|
0.39%
|
0.08%
|
—
|
| 45
|
Kenya
|
22,475
|
0.36%
|
0.07%
|
—
|
| 46
|
Ireland
|
22,370
|
0.36%
|
0.07%
|
Also known as the Republic of Ireland
|
| 47
|
Peru
|
22,080
|
0.36%
|
0.07%
|
—
|
| 48
|
Czech Republic
|
22,030
|
0.36%
|
0.07%
|
—
|
| 49
|
Malaysia
|
21,885
|
0.35%
|
0.07%
|
—
|
| 50
|
Japan
|
21,705
|
0.35%
|
0.07%
|
—
|
| 51
|
Turkey
|
21,580
|
0.35%
|
0.07%
|
—
|
| 52
|
Israel
|
21,320
|
0.34%
|
0.07%
|
—
|
| 53
|
Austria
|
20,795
|
0.34%
|
0.07%
|
—
|
| 54
|
Belgium
|
20,215
|
0.33%
|
0.06%
|
—
|
| 55
|
Cambodia
|
20,190
|
0.33%
|
0.06%
|
—
|
| 56
|
Switzerland
|
19,955
|
0.32%
|
0.06%
|
—
|
| 57
|
Tanzania
|
19,765
|
0.32%
|
0.06%
|
—
|
| 58
|
Ethiopia
|
19,715
|
0.32%
|
0.06%
|
—
|
| 59
|
Somalia
|
19,515
|
0.32%
|
0.06%
|
—
|
| 60
|
Ghana
|
18,830
|
0.3%
|
0.06%
|
—
|
| —
|
Total immigrants
|
6,186,950
|
100%
|
19.8%
|
—
|
2001 census
The 2001 census reported that immigrants comprised 5,448,480 individuals or 18.4 percent of the total Canadian population. Of the total immigrant population, the top countries of origin were United Kingdom (605,995 persons or 11.1%), China (332,825 persons or 6.1%), Italy (315,455 persons or 5.8%), India (314,690 persons or 5.8%), United States (237,920 persons or 4.4%), Hong Kong (235,620 persons or 4.3%), Philippines (232,670 persons or 4.3%), Poland (180,415 persons or 3.3%), Germany (174,070 persons or 3.2%), and Portugal (153,535 persons or 2.8%).[27][28][29][30]
Total immigrant population by country of birth, 2001 Canadian census[27][28][29][30]
Immigrant refers to all those who hold or have ever held permanent resident status in Canada, including naturalized citizens.
| Rank
|
Country of birth
|
Immigrant population
|
Proportion of immigrants in Canada
|
Proportion of Canadian population
|
Notes
|
| —
|
Canada
|
5,448,480
|
100%
|
18.38%
|
—
|
| 1
|
United Kingdom
|
605,995
|
11.12%
|
2.04%
|
Officially the United Kingdom of Great Britain and Northern Ireland. Includes Scotland, Wales, England and Northern Ireland. Excludes Isle of Man, the Channel Islands, and British Overseas Territories.
|
| 2
|
China
|
332,825
|
6.11%
|
1.12%
|
Officially the People's Republic of China. Excludes Hong Kong and Macau (included in this table below).
|
| 3
|
Italy
|
315,455
|
5.79%
|
1.06%
|
—
|
| 4
|
India
|
314,690
|
5.78%
|
1.06%
|
—
|
| 5
|
United States
|
237,920
|
4.37%
|
0.8%
|
—
|
| 6
|
Hong Kong
|
235,620
|
4.32%
|
0.79%
|
Officially the Hong Kong Special Administrative Region of China.
|
| 7
|
Philippines
|
232,670
|
4.27%
|
0.79%
|
—
|
| 8
|
Poland
|
180,415
|
3.31%
|
0.61%
|
—
|
| 9
|
Germany
|
174,070
|
3.19%
|
0.59%
|
—
|
| 10
|
Portugal
|
153,535
|
2.82%
|
0.52%
|
—
|
| 11
|
Vietnam
|
148,405
|
2.72%
|
0.5%
|
Many from the former Republic of Vietnam
|
| 12
|
Yugoslavia
|
145,380
|
2.67%
|
0.49%
|
Serbia: 63,875 / Croatia: 39,375 / Bosnia: 25,665 / Slovenia: 9,250 / Macedonia: 7,215
|
| 13
|
 Soviet Union Soviet Union
|
141,960
|
2.61%
|
0.48%
|
Ukrainian SSR: 51,610 / Russian SFSR: 48,425 / Baltic: 20,905 / Other: 21,020
|
| 14
|
Jamaica
|
120,210
|
2.21%
|
0.41%
|
—
|
| 15
|
Netherlands
|
117,690
|
2.16%
|
0.4%
|
—
|
| 16
|
Sri Lanka
|
87,305
|
1.6%
|
0.29%
|
—
|
| 17
|
Guyana
|
83,535
|
1.53%
|
0.28%
|
—
|
| 18
|
Pakistan
|
79,310
|
1.46%
|
0.27%
|
—
|
| 19
|
Greece
|
75,765
|
1.39%
|
0.26%
|
—
|
| 20
|
Iran
|
71,985
|
1.32%
|
0.24%
|
—
|
| 21
|
South Korea & North Korea
|
70,635
|
1.3%
|
0.24%
|
Includes South Korea and North Korea.
|
| 22
|
France
|
69,460
|
1.27%
|
0.23%
|
—
|
| 23
|
Lebanon
|
67,225
|
1.23%
|
0.23%
|
—
|
| 24
|
Taiwan
|
67,095
|
1.23%
|
0.23%
|
—
|
| 25
|
Trinidad and Tobago
|
64,145
|
1.18%
|
0.22%
|
—
|
| 26
|
Romania
|
60,165
|
1.1%
|
0.2%
|
—
|
| 27
|
Haiti
|
52,625
|
0.97%
|
0.18%
|
—
|
| 28
|
Hungary
|
48,715
|
0.89%
|
0.16%
|
—
|
| 29
|
Scandinavia
|
45,165
|
0.83%
|
0.15%
|
Denmark: 17,805 / Finland: 14,030 / Sweden: 6,810 / Norway: 6,105 / Iceland: 415
|
| 30
|
Czechoslovakia
|
39,760
|
0.73%
|
0.13%
|
—
|
| 31
|
El Salvador
|
38,460
|
0.71%
|
0.13%
|
—
|
| 32
|
Mexico
|
36,225
|
0.66%
|
0.12%
|
—
|
| 33
|
Egypt
|
35,975
|
0.66%
|
0.12%
|
—
|
| 34
|
South Africa
|
34,990
|
0.64%
|
0.12%
|
—
|
| 35
|
Ireland
|
25,850
|
0.47%
|
0.09%
|
Also known as the Republic of Ireland
|
| 36
|
Iraq
|
25,830
|
0.47%
|
0.09%
|
—
|
| 37
|
Morocco
|
24,640
|
0.45%
|
0.08%
|
—
|
| 38
|
Chile
|
24,495
|
0.45%
|
0.08%
|
—
|
| 39
|
Fiji
|
22,340
|
0.41%
|
0.08%
|
—
|
| 40
|
Austria
|
22,135
|
0.41%
|
0.07%
|
—
|
| 41
|
Bangladesh
|
21,595
|
0.4%
|
0.07%
|
—
|
| 42
|
Afghanistan
|
21,710
|
0.4%
|
0.07%
|
—
|
| 43
|
Malaysia
|
20,420
|
0.37%
|
0.07%
|
—
|
| 44
|
Switzerland
|
20,020
|
0.37%
|
0.07%
|
—
|
| 45
|
Kenya
|
19,815
|
0.36%
|
0.07%
|
—
|
| 46
|
Belgium
|
19,760
|
0.36%
|
0.07%
|
—
|
| 47
|
Tanzania
|
19,315
|
0.35%
|
0.07%
|
—
|
| 48
|
Algeria
|
19,095
|
0.35%
|
0.06%
|
—
|
| 49
|
Cambodia
|
18,745
|
0.34%
|
0.06%
|
—
|
| 50
|
Somalia
|
18,635
|
0.34%
|
0.06%
|
—
|
| 51
|
Japan
|
17,625
|
0.32%
|
0.06%
|
—
|
| 52
|
Peru
|
17,125
|
0.31%
|
0.06%
|
—
|
| 53
|
Turkey
|
16,410
|
0.3%
|
0.06%
|
—
|
| 54
|
Ghana
|
16,145
|
0.3%
|
0.05%
|
—
|
| 55
|
Israel
|
15,995
|
0.29%
|
0.05%
|
—
|
| 56
|
Syria
|
15,680
|
0.29%
|
0.05%
|
—
|
| 57
|
Colombia
|
15,505
|
0.28%
|
0.05%
|
—
|
| 58
|
Barbados
|
14,650
|
0.27%
|
0.05%
|
—
|
| 59
|
Laos
|
14,110
|
0.26%
|
0.05%
|
—
|
| 60
|
Ethiopia
|
13,710
|
0.25%
|
0.05%
|
—
|
| —
|
Total immigrants
|
5,448,480
|
100%
|
18.38%
|
—
|
1996 census
The 1996 census reported that immigrants comprised 4,971,070 individuals or 17.4 percent of the total Canadian population. Of the total immigrant population, the top countries of origin were United Kingdom (655,535 persons or 13.2%), Italy (332,110 persons or 6.7%), United States (244,695 persons or 4.9%), Hong Kong (241,095 persons or 4.9%), India (235,930 persons or 4.8%), China (231,055 persons or 4.7%), Poland (193,375 persons or 3.9%), Philippines (184,550 persons or 3.7%), Germany (181,650 persons or 3.7%), and Portugal (158,815 persons or 3.2%).[31][32][33][34][29][30]
Total immigrant population by country of birth, 1996 Canadian census[31][32][33][34][29][30]
Immigrant refers to all those who hold or have ever held permanent resident status in Canada, including naturalized citizens.
| Rank
|
Country of birth
|
Immigrant population
|
Proportion of immigrants in Canada
|
Proportion of Canadian population
|
Notes
|
| —
|
Canada
|
4,971,070
|
100%
|
17.43%
|
—
|
| 1
|
United Kingdom
|
655,535
|
13.19%
|
2.3%
|
Includes England, Wales, Scotland, and Northern Ireland.
|
| 2
|
Italy
|
332,110
|
6.68%
|
1.16%
|
—
|
| 3
|
United States
|
244,695
|
4.92%
|
0.86%
|
—
|
| 4
|
Hong Kong
|
241,095
|
4.85%
|
0.85%
|
—
|
| 5
|
India
|
235,930
|
4.75%
|
0.83%
|
—
|
| 6
|
China
|
231,055
|
4.65%
|
0.81%
|
—
|
| 7
|
Poland
|
193,375
|
3.89%
|
0.68%
|
—
|
| 8
|
Philippines
|
184,550
|
3.71%
|
0.65%
|
—
|
| 9
|
Germany
|
181,650
|
3.65%
|
0.64%
|
—
|
| 10
|
Portugal
|
158,815
|
3.19%
|
0.56%
|
—
|
| 11
|
Vietnam
|
139,325
|
2.8%
|
0.49%
|
—
|
| 12
|
Netherlands
|
124,545
|
2.51%
|
0.44%
|
—
|
| 13
|
Yugoslavia
|
121,975
|
2.45%
|
0.43%
|
—
|
| 14
|
Jamaica
|
115,800
|
2.33%
|
0.41%
|
—
|
| 15
|
Soviet Union
|
108,390
|
2.18%
|
0.38%
|
—
|
| 16
|
Greece
|
79,695
|
1.6%
|
0.28%
|
—
|
| 17
|
Guyana
|
77,700
|
1.56%
|
0.27%
|
—
|
| 18
|
Sri Lanka
|
67,425
|
1.36%
|
0.24%
|
—
|
| 19
|
Lebanon
|
63,130
|
1.27%
|
0.22%
|
—
|
| 20
|
France
|
62,600
|
1.26%
|
0.22%
|
—
|
| 21
|
Trinidad and Tobago
|
62,020
|
1.25%
|
0.22%
|
—
|
| 22
|
Hungary
|
54,225
|
1.09%
|
0.19%
|
—
|
| 23
|
Scandinavia
|
50,145
|
1.01%
|
0.18%
|
—
|
| 24
|
Haiti
|
49,395
|
0.99%
|
0.17%
|
—
|
| 25
|
Taiwan
|
49,290
|
0.99%
|
0.17%
|
—
|
| 26
|
Iran
|
47,405
|
0.95%
|
0.17%
|
—
|
| 27
|
Romania
|
46,400
|
0.93%
|
0.16%
|
—
|
| 28
|
South Korea & North Korea
|
46,025
|
0.93%
|
0.16%
|
—
|
| 29
|
Czechoslovakia
|
41,225
|
0.83%
|
0.14%
|
—
|
| 30
|
Pakistan
|
39,245
|
0.79%
|
0.14%
|
—
|
| 31
|
El Salvador
|
39,020
|
0.78%
|
0.14%
|
—
|
| 32
|
Other Caribbean
|
36,965
|
0.74%
|
0.13%
|
—
|
| 33
|
Egypt
|
33,930
|
0.68%
|
0.12%
|
—
|
| 34
|
Ireland
|
28,940
|
0.58%
|
0.1%
|
—
|
| 35
|
South Africa
|
28,465
|
0.57%
|
0.1%
|
—
|
| 36
|
Mexico
|
27,480
|
0.55%
|
0.1%
|
—
|
| 37
|
Austria
|
24,600
|
0.49%
|
0.09%
|
—
|
| 38
|
Chile
|
23,880
|
0.48%
|
0.08%
|
—
|
| 39
|
Other Central & West Asia
|
22,730
|
0.46%
|
0.08%
|
—
|
| 40
|
Belgium
|
21,805
|
0.44%
|
0.08%
|
—
|
| 41
|
Fiji
|
20,580
|
0.41%
|
0.07%
|
—
|
| 42
|
Morocco
|
20,435
|
0.41%
|
0.07%
|
—
|
| 43
|
Israel & Palestine
|
20,390
|
0.41%
|
0.07%
|
—
|
| 44
|
Malaysia
|
19,460
|
0.39%
|
0.07%
|
—
|
| 45
|
Other South America
|
19,445
|
0.39%
|
0.07%
|
—
|
| 46
|
Cambodia
|
19,355
|
0.39%
|
0.07%
|
—
|
| 47
|
Switzerland
|
19,310
|
0.39%
|
0.07%
|
—
|
| 48
|
Ethiopia
|
18,595
|
0.37%
|
0.07%
|
—
|
| 49
|
Tanzania
|
18,130
|
0.36%
|
0.06%
|
—
|
| 50
|
Kenya
|
18,005
|
0.36%
|
0.06%
|
—
|
| 51
|
Other East Africa
|
17,555
|
0.35%
|
0.06%
|
—
|
| 52
|
Iraq
|
16,795
|
0.34%
|
0.06%
|
—
|
| 53
|
Somalia
|
16,740
|
0.34%
|
0.06%
|
—
|
| 54
|
Peru
|
15,235
|
0.31%
|
0.05%
|
—
|
| 55
|
Barbados
|
15,225
|
0.31%
|
0.05%
|
—
|
| 56
|
Japan
|
14,990
|
0.3%
|
0.05%
|
—
|
| 57
|
Laos
|
14,765
|
0.3%
|
0.05%
|
—
|
| 58
|
Australia
|
14,660
|
0.29%
|
0.05%
|
—
|
| 59
|
Turkey
|
14,430
|
0.29%
|
0.05%
|
—
|
| 60
|
Other East & Southeast Asia
|
14,300
|
0.29%
|
0.05%
|
—
|
| 61
|
Guatemala
|
13,270
|
0.27%
|
0.05%
|
—
|
| 62
|
Syria
|
13,105
|
0.26%
|
0.05%
|
—
|
| 63
|
Ghana
|
13,085
|
0.26%
|
0.05%
|
—
|
| 64
|
Argentina
|
11,740
|
0.24%
|
0.04%
|
—
|
| 65
|
Spain
|
11,240
|
0.23%
|
0.04%
|
—
|
| 66
|
Afghanistan
|
10,915
|
0.22%
|
0.04%
|
—
|
| 67
|
Other South Asia
|
10,910
|
0.22%
|
0.04%
|
—
|
| 68
|
Uganda
|
10,755
|
0.22%
|
0.04%
|
—
|
| 69
|
Ecuador
|
9,640
|
0.19%
|
0.03%
|
—
|
| 70
|
Colombia
|
9,465
|
0.19%
|
0.03%
|
—
|
| 71
|
Malta
|
9,445
|
0.19%
|
0.03%
|
—
|
| 72
|
Other West Africa
|
9,440
|
0.19%
|
0.03%
|
—
|
| 73
|
Brazil
|
9,360
|
0.19%
|
0.03%
|
—
|
| 74
|
Other Central America
|
9,025
|
0.18%
|
0.03%
|
—
|
| 75
|
Nicaragua
|
8,545
|
0.17%
|
0.03%
|
—
|
| 76
|
Indonesia
|
8,515
|
0.17%
|
0.03%
|
—
|
| 77
|
Other North Africa
|
8,355
|
0.17%
|
0.03%
|
—
|
| 78
|
Algeria
|
8,005
|
0.16%
|
0.03%
|
—
|
| 79
|
Other Europe
|
7,980
|
0.16%
|
0.03%
|
—
|
| 80
|
Singapore
|
7,970
|
0.16%
|
0.03%
|
—
|
| 81
|
Other Central & Southern Africa
|
7,810
|
0.16%
|
0.03%
|
—
|
| 82
|
Thailand
|
7,710
|
0.16%
|
0.03%
|
—
|
| 83
|
Others
|
13,780
|
0.28%
|
0.05%
|
—
|
| —
|
Total immigrants
|
4,971,070
|
100%
|
17.43%
|
—
|
1991 census
The 1991 census reported that immigrants comprised 4,342,890 individuals or 16.1 percent of the total Canadian population. Of the total immigrant population, the top countries of origin were United Kingdom (717,750 persons or 16.5%), Italy (351,615 persons or 8.1%), United States (249,075 persons or 5.7%), Poland (184,695 persons or 4.3%), Germany (180,525 persons or 4.2%), India (173,675 persons or 4%), Portugal (161,180 persons or 3.7%), China (157,405 persons or 3.6%), Hong Kong (152,450 persons or 3.5%), and Netherlands (129,615 persons or 3%).[34][30]
Total immigrant population by country of birth, 1991 Canadian census[34][30]
Immigrant refers to all those who hold or have ever held permanent resident status in Canada, including naturalized citizens.
| Rank
|
Country of birth
|
Immigrant population
|
Proportion of immigrants in Canada
|
Proportion of Canadian population
|
Notes
|
| —
|
Canada
|
4,342,890
|
100%
|
16.09%
|
—
|
| 1
|
United Kingdom
|
717,750
|
16.53%
|
2.66%
|
Includes England, Wales, Scotland, and Northern Ireland.
|
| 2
|
Italy
|
351,615
|
8.1%
|
1.3%
|
—
|
| 3
|
United States
|
249,075
|
5.74%
|
0.92%
|
—
|
| 4
|
Poland
|
184,695
|
4.25%
|
0.68%
|
—
|
| 5
|
Germany
|
180,525
|
4.16%
|
0.67%
|
—
|
| 6
|
India
|
173,675
|
4%
|
0.64%
|
—
|
| 7
|
Portugal
|
161,180
|
3.71%
|
0.6%
|
—
|
| 8
|
China
|
157,405
|
3.62%
|
0.58%
|
Officially the People's Republic of China. Excludes Hong Kong and Macau.
|
| 9
|
.svg.png) Hong Kong Hong Kong
|
152,450
|
3.51%
|
0.56%
|
—
|
| 10
|
Netherlands
|
129,615
|
2.98%
|
0.48%
|
—
|
| 11
|
Philippines
|
123,295
|
2.84%
|
0.46%
|
—
|
| 12
|
Vietnam
|
113,595
|
2.62%
|
0.42%
|
Many from the former Republic of Vietnam.
|
| 13
|
Jamaica
|
102,440
|
2.36%
|
0.38%
|
—
|
| 14
|
Soviet Union
|
99,355
|
2.29%
|
0.37%
|
—
|
| 15
|
Yugoslavia
|
88,815
|
2.05%
|
0.33%
|
—
|
| 16
|
Greece
|
83,680
|
1.93%
|
0.31%
|
—
|
| 17
|
Guyana
|
66,060
|
1.52%
|
0.24%
|
—
|
| 18
|
Hungary
|
57,010
|
1.31%
|
0.21%
|
—
|
| 19
|
France
|
55,160
|
1.27%
|
0.2%
|
—
|
| 20
|
Scandinavia
|
54,980
|
1.27%
|
0.2%
|
—
|
| 21
|
Lebanon
|
54,600
|
1.26%
|
0.2%
|
—
|
| 22
|
Trinidad and Tobago
|
49,385
|
1.14%
|
0.18%
|
—
|
| 23
|
Czechoslovakia
|
42,615
|
0.98%
|
0.16%
|
—
|
| 24
|
Haiti
|
39,880
|
0.92%
|
0.15%
|
—
|
| 25
|
Romania
|
33,785
|
0.78%
|
0.13%
|
—
|
| 26
|
South Korea & North Korea
|
33,170
|
0.76%
|
0.12%
|
Includes South Korea and North Korea.
|
| 27
|
Iran
|
30,710
|
0.71%
|
0.11%
|
—
|
| 28
|
Ireland
|
28,405
|
0.65%
|
0.11%
|
Also known as the Republic of Ireland.
|
| 29
|
El Salvador
|
28,295
|
0.65%
|
0.1%
|
—
|
| 30
|
Egypt
|
28,020
|
0.65%
|
0.1%
|
—
|
| 31
|
Austria
|
26,680
|
0.61%
|
0.1%
|
—
|
| 32
|
Other Caribbean
|
25,995
|
0.6%
|
0.1%
|
—
|
| 33
|
Sri Lanka
|
25,435
|
0.59%
|
0.09%
|
—
|
| 34
|
Pakistan
|
25,180
|
0.58%
|
0.09%
|
—
|
| 35
|
.svg.png) South Africa South Africa
|
24,730
|
0.57%
|
0.09%
|
—
|
| 36
|
Chile
|
22,870
|
0.53%
|
0.08%
|
—
|
| 37
|
Belgium
|
22,480
|
0.52%
|
0.08%
|
—
|
| 38
|
Mexico
|
19,400
|
0.45%
|
0.07%
|
—
|
| 39
|
Cambodia
|
17,960
|
0.41%
|
0.07%
|
—
|
| 40
|
Tanzania
|
17,820
|
0.41%
|
0.07%
|
—
|
| 41
|
Taiwan
|
17,770
|
0.41%
|
0.07%
|
—
|
| 42
|
Morocco
|
16,790
|
0.39%
|
0.06%
|
—
|
| 43
|
Israel & Palestine
|
16,770
|
0.39%
|
0.06%
|
—
|
| 44
|
Kenya
|
16,585
|
0.38%
|
0.06%
|
—
|
| 45
|
Switzerland
|
16,330
|
0.38%
|
0.06%
|
—
|
| 46
|
Malaysia
|
16,100
|
0.37%
|
0.06%
|
—
|
| 47
|
Fiji
|
15,995
|
0.37%
|
0.06%
|
—
|
| 48
|
Other South America
|
15,840
|
0.36%
|
0.06%
|
—
|
| 49
|
Barbados
|
14,825
|
0.34%
|
0.05%
|
—
|
| 50
|
Laos
|
14,445
|
0.33%
|
0.05%
|
—
|
| 51
|
Australia
|
13,955
|
0.32%
|
0.05%
|
—
|
| 52
|
Other East Africa
|
12,570
|
0.29%
|
0.05%
|
—
|
| 53
|
Japan
|
12,280
|
0.28%
|
0.05%
|
—
|
| 54
|
Turkey
|
12,180
|
0.28%
|
0.05%
|
—
|
| 55
|
Peru
|
11,480
|
0.26%
|
0.04%
|
—
|
| 56
|
Spain
|
11,170
|
0.26%
|
0.04%
|
—
|
| 57
|
Argentina
|
11,110
|
0.26%
|
0.04%
|
—
|
| 58
|
Ethiopia
|
11,060
|
0.25%
|
0.04%
|
—
|
| 59
|
Syria
|
11,005
|
0.25%
|
0.04%
|
—
|
| 60
|
Other East & Southeast Asia
|
10,995
|
0.25%
|
0.04%
|
—
|
| 61
|
Malta
|
10,185
|
0.23%
|
0.04%
|
—
|
| 62
|
Uganda
|
8,960
|
0.21%
|
0.03%
|
—
|
| 63
|
Guatemala
|
8,920
|
0.21%
|
0.03%
|
—
|
| 64
|
Other Central & West Asia
|
8,815
|
0.2%
|
0.03%
|
—
|
| 65
|
Other Europe
|
8,665
|
0.2%
|
0.03%
|
—
|
| 66
|
Ecuador
|
8,015
|
0.18%
|
0.03%
|
—
|
| 67
|
Colombia
|
7,865
|
0.18%
|
0.03%
|
—
|
| 68
|
Indonesia
|
7,610
|
0.18%
|
0.03%
|
—
|
| 69
|
Brazil
|
7,330
|
0.17%
|
0.03%
|
—
|
| 70
|
Iraq
|
7,165
|
0.16%
|
0.03%
|
—
|
| 71
|
Ghana
|
6,675
|
0.15%
|
0.02%
|
—
|
| 72
|
Nicaragua
|
6,460
|
0.15%
|
0.02%
|
—
|
| 73
|
Singapore
|
6,285
|
0.14%
|
0.02%
|
—
|
| 74
|
Thailand
|
5,815
|
0.13%
|
0.02%
|
—
|
| 75
|
Other Central America
|
5,745
|
0.13%
|
0.02%
|
—
|
| 76
|
Afghanistan
|
5,545
|
0.13%
|
0.02%
|
—
|
| 77
|
Somalia
|
5,290
|
0.12%
|
0.02%
|
—
|
| 78
|
Other West Africa
|
5,285
|
0.12%
|
0.02%
|
—
|
| 79
|
Other North Africa
|
4,515
|
0.1%
|
0.02%
|
—
|
| 80
|
Other South Asia
|
4,500
|
0.1%
|
0.02%
|
—
|
| 81
|
Other Central & Southern Africa
|
3,985
|
0.09%
|
0.01%
|
—
|
| 82
|
Algeria
|
3,900
|
0.09%
|
0.01%
|
—
|
| 83
|
Others
|
16,305
|
0.38%
|
0.06%
|
—
|
| —
|
Total immigrants
|
4,342,890
|
100%
|
16.09%
|
—
|
1981 census
The 1981 census reported that immigrants comprised 3,867,160 individuals or 16.1 percent of the total Canadian population. Of the total immigrant population, the top countries of origin were United Kingdom (884,915 persons or 22.9%), Italy (386,505 persons or 10%), United States (312,015 persons or 8.1%), Germany (198,215 persons or 5.1%), Poland (148,940 persons or 3.9%), Portugal (139,765 persons or 3.6%), Netherlands (138,760 persons or 3.6%), Soviet Union (128,680 persons or 3.3%), India (109,660 persons or 2.8%), and Yugoslavia (91,870 persons or 2.4%).[35][36][37][38]
Total immigrant population by country of birth, 1981 Canadian census[35][36][37][38][30]
Immigrant refers to all those who hold or have ever held permanent resident status in Canada, including naturalized citizens.
| Rank
|
Country of birth
|
Immigrant population
|
Proportion of immigrants in Canada
|
Proportion of Canadian population
|
Notes
|
| —
|
Canada
|
3,867,160
|
100%
|
16.06%
|
—
|
| 1
|
United Kingdom
|
884,915
|
22.88%
|
3.67%
|
Includes England, Wales, Scotland, and Northern Ireland.
|
| 2
|
Italy
|
386,505
|
9.99%
|
1.6%
|
—
|
| 3
|
United States
|
312,015
|
8.07%
|
1.3%
|
—
|
| 4
|
Germany
|
198,215
|
5.13%
|
0.82%
|
—
|
| 5
|
Poland
|
148,940
|
3.85%
|
0.62%
|
—
|
| 6
|
Portugal
|
139,765
|
3.61%
|
0.58%
|
—
|
| 7
|
Netherlands
|
138,760
|
3.59%
|
0.58%
|
—
|
| 8
|
Soviet Union
|
128,680
|
3.33%
|
0.53%
|
—
|
| 9
|
India
|
109,660
|
2.84%
|
0.46%
|
—
|
| 10
|
Yugoslavia
|
91,870
|
2.38%
|
0.38%
|
—
|
| 11
|
Greece
|
90,070
|
2.33%
|
0.37%
|
—
|
| 12
|
Jamaica
|
78,165
|
2.02%
|
0.32%
|
—
|
| 13
|
Scandinavia
|
70,225
|
1.82%
|
0.29%
|
—
|
| 14
|
Hungary
|
64,735
|
1.67%
|
0.27%
|
—
|
| 15
|
Hong Kong
|
58,980
|
1.53%
|
0.24%
|
—
|
| 16
|
France
|
56,175
|
1.45%
|
0.23%
|
—
|
| 17
|
Philippines
|
55,460
|
1.43%
|
0.23%
|
—
|
| 18
|
Taiwan
|
54,320
|
1.4%
|
0.23%
|
—
|
| 19
|
China
|
52,395
|
1.35%
|
0.22%
|
—
|
| 20
|
Vietnam
|
50,710
|
1.31%
|
0.21%
|
—
|
| 21
|
Czechoslovakia
|
41,660
|
1.08%
|
0.17%
|
—
|
| 22
|
Trinidad and Tobago
|
38,655
|
1%
|
0.16%
|
—
|
| 23
|
Guyana
|
38,060
|
0.98%
|
0.16%
|
—
|
| 24
|
Austria
|
34,325
|
0.89%
|
0.14%
|
—
|
| 25
|
Haiti
|
25,865
|
0.67%
|
0.11%
|
—
|
| 26
|
Belgium
|
25,250
|
0.65%
|
0.1%
|
—
|
| 27
|
Romania
|
24,350
|
0.63%
|
0.1%
|
—
|
| 28
|
Lebanon
|
22,595
|
0.58%
|
0.09%
|
—
|
| 29
|
Egypt
|
21,870
|
0.57%
|
0.09%
|
—
|
| 30
|
Other Southeast Asia
|
20,965
|
0.54%
|
0.09%
|
—
|
| 31
|
Other West Asia
|
20,940
|
0.54%
|
0.09%
|
—
|
| 32
|
Other South America
|
20,295
|
0.52%
|
0.08%
|
—
|
| 33
|
Switzerland
|
16,955
|
0.44%
|
0.07%
|
—
|
| 34
|
Ireland
|
16,755
|
0.43%
|
0.07%
|
—
|
| 35
|
Other Caribbean
|
16,145
|
0.42%
|
0.07%
|
—
|
| 36
|
South Africa
|
15,860
|
0.41%
|
0.07%
|
—
|
| 37
|
Chile
|
15,330
|
0.4%
|
0.06%
|
—
|
| 38
|
Pakistan
|
15,140
|
0.39%
|
0.06%
|
—
|
| 39
|
Australia
|
14,800
|
0.38%
|
0.06%
|
—
|
| 40
|
Barbados
|
14,310
|
0.37%
|
0.06%
|
—
|
| 41
|
Spain
|
12,855
|
0.33%
|
0.05%
|
—
|
| 42
|
Japan
|
11,910
|
0.31%
|
0.05%
|
—
|
| 43
|
Morocco
|
11,840
|
0.31%
|
0.05%
|
—
|
| 44
|
Tanzania
|
11,480
|
0.3%
|
0.05%
|
—
|
| 45
|
Mexico
|
11,310
|
0.29%
|
0.05%
|
—
|
| 46
|
Israel
|
11,205
|
0.29%
|
0.05%
|
—
|
| 47
|
Malta
|
10,585
|
0.27%
|
0.04%
|
—
|
| 48
|
South Korea
|
10,165
|
0.26%
|
0.04%
|
—
|
| 49
|
Fiji
|
10,120
|
0.26%
|
0.04%
|
—
|
| 50
|
Kenya
|
9,225
|
0.24%
|
0.04%
|
—
|
| 51
|
Other East Asia
|
8,975
|
0.23%
|
0.04%
|
—
|
| 52
|
Laos
|
8,855
|
0.23%
|
0.04%
|
—
|
| 53
|
Turkey
|
8,805
|
0.23%
|
0.04%
|
—
|
| 54
|
Uganda
|
8,640
|
0.22%
|
0.04%
|
—
|
| 55
|
Other Oceania
|
8,595
|
0.22%
|
0.04%
|
—
|
| 56
|
Other Southern Africa
|
7,585
|
0.2%
|
0.03%
|
—
|
| 57
|
Argentina
|
7,235
|
0.19%
|
0.03%
|
—
|
| 58
|
Other Central America
|
6,035
|
0.16%
|
0.03%
|
—
|
| 59
|
Ecuador
|
5,835
|
0.15%
|
0.02%
|
—
|
| 60
|
Cambodia
|
5,595
|
0.14%
|
0.02%
|
—
|
| 61
|
Other East Africa
|
5,190
|
0.13%
|
0.02%
|
—
|
| 62
|
Other North Africa
|
5,155
|
0.13%
|
0.02%
|
—
|
| 63
|
West Africa
|
4,760
|
0.12%
|
0.02%
|
—
|
| 64
|
Other Europe
|
4,480
|
0.12%
|
0.02%
|
—
|
| 65
|
Brazil
|
4,340
|
0.11%
|
0.02%
|
—
|
| 66
|
Sri Lanka
|
4,195
|
0.11%
|
0.02%
|
—
|
| 67
|
Other South Asia
|
1,630
|
0.04%
|
0.01%
|
—
|
| 68
|
Central Africa
|
1,105
|
0.03%
|
0%
|
—
|
| 69
|
Other countries
|
6,740
|
0.17%
|
0.03%
|
—
|
| —
|
Total immigrants
|
3,867,160
|
100%
|
16.06%
|
—
|
1971 census
The 1971 census reported that immigrants comprised 3,295,535 individuals or 15.3 percent of the total Canadian population. Of the total immigrant population, the top countries of origin were United Kingdom (933,045 persons or 28.3%), Italy (385,760 persons or 11.7%), United States (309,640 persons or 9.4%), Germany (211,060 persons or 6.4%), Soviet Union (160,125 persons or 4.9%), Poland (160,035 persons or 4.9%), Netherlands (133,525 persons or 4.1%), Scandinavia (85,140 persons or 2.6%), Greece (78,780 persons or 2.4%), and Yugoslavia (78,285 persons or 2.4%).[39][40]: 9 [41]
Total immigrant population by country of birth, 1971 Canadian census[39][40]: 9 [41][30]
Immigrant refers to all those who hold or have ever held permanent resident status in Canada, including naturalized citizens.
| Rank
|
Country of birth
|
Immigrant population
|
Proportion of immigrants in Canada
|
Proportion of Canadian population
|
Notes
|
| —
|
Canada
|
3,295,535
|
100%
|
15.28%
|
—
|
| 1
|
United Kingdom
|
933,045
|
28.31%
|
4.33%
|
Includes England, Wales, Scotland, and Northern Ireland.
|
| 2
|
Italy
|
385,760
|
11.71%
|
1.79%
|
—
|
| 3
|
United States
|
309,640
|
9.4%
|
1.44%
|
—
|
| 4
|
Germany
|
211,060
|
6.4%
|
0.98%
|
—
|
| 5
|
Soviet Union
|
160,125
|
4.86%
|
0.74%
|
—
|
| 6
|
Poland
|
160,035
|
4.86%
|
0.74%
|
—
|
| 7
|
Netherlands
|
133,525
|
4.05%
|
0.62%
|
—
|
| 8
|
Scandinavia
|
85,140
|
2.58%
|
0.39%
|
—
|
| 9
|
Greece
|
78,780
|
2.39%
|
0.37%
|
—
|
| 10
|
Yugoslavia
|
78,285
|
2.38%
|
0.36%
|
—
|
| 11
|
Portugal
|
71,540
|
2.17%
|
0.33%
|
—
|
| 12
|
Hungary
|
68,490
|
2.08%
|
0.32%
|
—
|
| 13
|
China
|
57,150
|
1.73%
|
0.26%
|
—
|
| 14
|
Other Asia
|
55,465
|
1.68%
|
0.26%
|
—
|
| 15
|
France
|
51,660
|
1.57%
|
0.24%
|
—
|
| 16
|
Africa
|
45,510
|
1.38%
|
0.21%
|
—
|
| 17
|
India & Pakistan
|
43,645
|
1.32%
|
0.2%
|
—
|
| 18
|
Czechoslovakia
|
43,100
|
1.31%
|
0.2%
|
—
|
| 19
|
Jamaica & Trinidad and Tobago
|
42,050
|
1.28%
|
0.19%
|
—
|
| 20
|
Austria
|
40,445
|
1.23%
|
0.19%
|
—
|
| 21
|
Ireland
|
38,490
|
1.17%
|
0.18%
|
—
|
| 22
|
Central America & South America
|
36,040
|
1.09%
|
0.17%
|
—
|
| 23
|
Other Caribbean
|
26,040
|
0.79%
|
0.12%
|
—
|
| 24
|
Belgium
|
25,770
|
0.78%
|
0.12%
|
—
|
| 25
|
Romania
|
24,405
|
0.74%
|
0.11%
|
—
|
| 26
|
Australia
|
14,335
|
0.43%
|
0.07%
|
—
|
| 27
|
Switzerland
|
13,895
|
0.42%
|
0.06%
|
—
|
| 28
|
.svg.png) Spain Spain
|
10,500
|
0.32%
|
0.05%
|
—
|
| 29
|
Japan
|
9,485
|
0.29%
|
0.04%
|
—
|
| 30
|
Malta
|
9,230
|
0.28%
|
0.04%
|
—
|
| 31
|
Other Oceania
|
5,895
|
0.18%
|
0.03%
|
—
|
| 32
|
Other Eastern Europe
|
2,045
|
0.06%
|
0.01%
|
—
|
| 33
|
Other Southern Europe
|
770
|
0.02%
|
0%
|
—
|
| 34
|
Luxembourg
|
600
|
0.02%
|
0%
|
—
|
| 35
|
Other Western Europe
|
90
|
0%
|
0%
|
—
|
| 36
|
Other countries
|
23,490
|
0.71%
|
0.11%
|
—
|
| —
|
Total immigrants
|
3,295,535
|
100%
|
15.28%
|
—
|
1961 census
The 1961 census reported that immigrants comprised 2,844,263 individuals or 15.6 percent of the total Canadian population. Of the total immigrant population, the top countries of origin were United Kingdom (908,127 persons or 31.9%), Soviet Union & Poland (358,120 persons or 12.6%), United States (283,908 persons or 9.9%), Germany & Austria (259,323 persons or 9.1%), Italy (258,071 persons or 9.1%), Netherlands (135,033 persons or 4.8%), Scandinavia (104,083 persons or 3.7%),Ireland (92,477 persons or 3.3%), Hungary (72,900 persons or 2.6%), and Yugoslavia (50,826 persons or 1.8%).[39][40]: 9 [42]
Total immigrant population by country of birth, 1961 Canadian census[39][40]: 9 [42]
Immigrant refers to all those who hold or have ever held permanent resident status in Canada, including naturalized citizens.
| Rank
|
Country of birth
|
Immigrant population
|
Proportion of immigrants in Canada
|
Proportion of Canadian population
|
Notes
|
| —
|
.svg.png) Canada Canada
|
2,844,263
|
100%
|
15.6%
|
—
|
| 1
|
United Kingdom
|
908,127
|
31.93%
|
4.98%
|
 England: 638,855 / England: 638,855 /  Scotland: 244,052 / Scotland: 244,052 /  Wales: 23,247 / Other: 1,973 Wales: 23,247 / Other: 1,973
|
| 2
|
Soviet Union & Poland
|
358,120
|
12.59%
|
1.96%
|
Soviet Union: 186,653 / Poland: 171,467
|
| 3
|
United States
|
283,908
|
9.98%
|
1.56%
|
—
|
| 4
|
Germany & Austria
|
259,323
|
9.12%
|
1.42%
|
Germany: 189,131 / Austria: 70,192
|
| 5
|
Italy
|
258,071
|
9.07%
|
1.41%
|
—
|
| 6
|
Netherlands
|
135,033
|
4.75%
|
0.74%
|
—
|
| 7
|
Scandinavia
|
104,083
|
3.66%
|
0.57%
|
Denmark: 30,869 / Finland: 29,467 / Norway: 22,267 / Sweden: 19,338 / Iceland: 2,142
|
| 8
|
Ireland
|
92,477
|
3.25%
|
0.51%
|
.svg.png) Northern Ireland: 61,588 / Ireland: 30,889 Northern Ireland: 61,588 / Ireland: 30,889
|
| 9
|
Hungary
|
72,900
|
2.56%
|
0.4%
|
—
|
| 10
|
Yugoslavia
|
50,826
|
1.79%
|
0.28%
|
—
|
| 11
|
.svg.png) Greece Greece
|
38,017
|
1.34%
|
0.21%
|
—
|
| 12
|
China
|
36,724
|
1.29%
|
0.2%
|
—
|
| 13
|
France
|
36,103
|
1.27%
|
0.2%
|
—
|
| 14
|
Czechoslovakia
|
35,743
|
1.26%
|
0.2%
|
—
|
| 15
|
Belgium
|
28,253
|
0.99%
|
0.15%
|
—
|
| 16
|
Romania
|
27,011
|
0.95%
|
0.15%
|
—
|
| 17
|
Other Europe
|
22,305
|
0.78%
|
0.12%
|
—
|
| 18
|
Other British Commonwealth
|
15,808
|
0.56%
|
0.09%
|
—
|
| 19
|
Other Asia
|
14,240
|
0.5%
|
0.08%
|
—
|
| 20
|
British West Indies
|
12,363
|
0.43%
|
0.07%
|
—
|
| 21
|
Switzerland
|
11,381
|
0.4%
|
0.06%
|
—
|
| 22
|
India & Pakistan
|
9,028
|
0.32%
|
0.05%
|
—
|
| 23
|
Japan
|
6,797
|
0.24%
|
0.04%
|
—
|
| 24
|
Australia
|
6,663
|
0.23%
|
0.04%
|
—
|
| 25
|
South Africa
|
4,025
|
0.14%
|
0.02%
|
—
|
| 26
|
Other countries
|
16,934
|
0.6%
|
0.09%
|
—
|
| —
|
Total immigrants
|
2,844,263
|
100%
|
15.6%
|
—
|
1951 census
The 1951 census reported that immigrants comprised 2,059,911 individuals or 14.7 percent of the total Canadian population. Of the total immigrant population, the top countries of origin were United Kingdom (855,797 persons or 41.6%), Soviet Union & Poland (352,766 persons or 17.1%), United States (282,010 persons or 13.7%), Scandinavia (86,557 persons or 4.2%), Ireland (80,795 persons or 3.9%), Germany & Austria (80,291 persons or 3.9%), Italy (57,789 persons or 2.8%), Netherlands (41,457 persons or 2%), Hungary (32,929 persons or 1.6%), and Czechoslovakia (29,546 persons or 1.4%).[39][40]: 9 [43]: 675
Total immigrant population by country of birth, 1951 Canadian census[39][40]: 9 [43]: 675
Immigrant refers to all those who hold or have ever held permanent resident status in Canada, including naturalized citizens.
| Rank
|
Country of birth
|
Immigrant population
|
Proportion of immigrants in Canada
|
Proportion of Canadian population
|
Notes
|
| —
|
.svg.png) Canada Canada
|
2,059,911
|
100%
|
14.7%
|
—
|
| 1
|
United Kingdom
|
855,797
|
41.55%
|
6.11%
|
England & Wales: 627,551 / Scotland: 226,343 / Lesser Isles: 1,903
|
| 2
|
Soviet Union & Poland
|
352,766
|
17.13%
|
2.52%
|
Soviet Union: 188,292 / Poland: 164,474
|
| 3
|
United States
|
282,010
|
13.69%
|
2.01%
|
—
|
| 4
|
Scandinavia
|
86,557
|
4.2%
|
0.62%
|
Norway: 22,969 / Sweden: 22,635 / Finland: 22,035 / Denmark: 15,679 / Iceland: 3,239
|
| 5
|
Ireland
|
80,795
|
3.92%
|
0.58%
|
Northern Ireland: 56,685 / Ireland: 24,110
|
| 6
|
Germany & Austria
|
80,291
|
3.9%
|
0.57%
|
Germany: 42,693 / Austria: 37,598
|
| 7
|
Italy
|
57,789
|
2.81%
|
0.41%
|
—
|
| 8
|
Netherlands
|
41,457
|
2.01%
|
0.3%
|
—
|
| 9
|
.svg.png) Hungary Hungary
|
32,929
|
1.6%
|
0.24%
|
—
|
| 10
|
Czechoslovakia
|
29,546
|
1.43%
|
0.21%
|
—
|
| 11
|
China
|
24,166
|
1.17%
|
0.17%
|
—
|
| 12
|
Yugoslavia
|
20,912
|
1.02%
|
0.15%
|
—
|
| 13
|
Romania
|
19,733
|
0.96%
|
0.14%
|
—
|
| 14
|
Belgium
|
17,251
|
0.84%
|
0.12%
|
—
|
| 15
|
France
|
15,650
|
0.76%
|
0.11%
|
—
|
| 16
|
Greece
|
8,594
|
0.42%
|
0.06%
|
—
|
| 17
|
Other Europe
|
7,619
|
0.37%
|
0.05%
|
—
|
| 18
|
Other Asia
|
6,740
|
0.33%
|
0.05%
|
—
|
| 19
|
Other British Commonwealth
|
6,527
|
0.32%
|
0.05%
|
—
|
| 20
|
Switzerland
|
6,414
|
0.31%
|
0.05%
|
—
|
| 21
|
Japan
|
6,239
|
0.3%
|
0.04%
|
—
|
| 22
|
Australia
|
4,161
|
0.2%
|
0.03%
|
—
|
| 23
|
India & Pakistan
|
3,934
|
0.19%
|
0.03%
|
—
|
| 24
|
British West Indies
|
3,888
|
0.19%
|
0.03%
|
—
|
| 25
|
South Africa
|
2,057
|
0.1%
|
0.01%
|
—
|
| 26
|
Other countries
|
6,089
|
0.3%
|
0.04%
|
—
|
| —
|
Total immigrants
|
2,059,911
|
100%
|
14.7%
|
—
|
1941 census
The 1941 census reported that immigrants comprised 2,018,847 individuals or 17.6 percent of the total Canadian population. Of the total immigrant population, the top countries of origin were United Kingdom (873,999 persons or 44.3%), United States (312,473 persons or 15.5%), Poland & Soviet Union (279,802 persons or 13.9%), Scandinavia (96,860 persons or 4.8%), Ireland (86,126 persons or 4.3%), Austria & Germany (79,192 persons or 3.9%), Italy (40,432 persons or 2%), Hungary (31,813 persons or 1.6%), China (29,095 persons or 1.4%), and Romania (28,454 persons or 1.4%).[39][40]: 9 [44]: 163 [45]: 257 [46]: 292
Total immigrant population by country of birth, 1941 Canadian census[39][40]: 9 [44]: 163 [45]: 257 [46]: 292
Immigrant refers to all those who hold or have ever held permanent resident status in Canada, including naturalized citizens.
| Rank
|
Country of birth
|
Immigrant population
|
Proportion of immigrants in Canada
|
Proportion of Canadian population
|
Notes
|
| —
|
Canada
|
2,018,847
|
100%
|
17.55%
|
—
|
| 1
|
United Kingdom
|
873,999
|
43.29%
|
7.6%
|
England: 615,781 / Scotland: 234,824 / Wales: 19,440 / Lesser Isles: 3,954
|
| 2
|
United States
|
312,473
|
15.48%
|
2.72%
|
—
|
| 3
|
Poland & Soviet Union
|
279,802
|
13.86%
|
2.43%
|
Poland: 155,400 / Soviet Union: 117,598 / .svg.png) Lithuanian SSR: 6,804 Lithuanian SSR: 6,804
|
| 4
|
Scandinavia
|
96,860
|
4.8%
|
0.84%
|
Sweden: 27,160 / Norway: 26,914 / Finland: 24,387 / Denmark: 13,974 / Iceland: 4,425
|
| 5
|
Ireland
|
86,126
|
4.27%
|
0.75%
|
Also includes Northern Ireland.
|
| 6
|
.svg.png) Austria & Germany Austria & Germany
|
79,192
|
3.92%
|
0.69%
|
Austria: 50,713 / Germany: 28,479
|
| 7
|
.svg.png) Italy Italy
|
40,432
|
2%
|
0.35%
|
—
|
| 8
|
.svg.png) Hungary Hungary
|
31,813
|
1.58%
|
0.28%
|
—
|
| 9
|
China
|
29,095
|
1.44%
|
0.25%
|
—
|
| 10
|
Romania
|
28,454
|
1.41%
|
0.25%
|
—
|
| 11
|
 Newfoundland Newfoundland
|
25,837
|
1.28%
|
0.22%
|
—
|
| 12
|
Czechoslovakia
|
25,564
|
1.27%
|
0.22%
|
—
|
| 13
|
Yugoslavia
|
17,416
|
0.86%
|
0.15%
|
—
|
| 14
|
Belgium
|
14,773
|
0.73%
|
0.13%
|
—
|
| 15
|
France
|
13,795
|
0.68%
|
0.12%
|
—
|
| 16
|
Netherlands
|
9,923
|
0.49%
|
0.09%
|
—
|
| 17
|
Japan
|
9,462
|
0.47%
|
0.08%
|
—
|
| 18
|
Greece
|
5,871
|
0.29%
|
0.05%
|
—
|
| 19
|
Switzerland
|
5,505
|
0.27%
|
0.05%
|
—
|
| 20
|
 India India
|
4,376
|
0.22%
|
0.04%
|
—
|
| 21
|
British West Indies
|
4,134
|
0.2%
|
0.04%
|
—
|
| 22
|
Other British Commonwealth
|
3,777
|
0.19%
|
0.03%
|
—
|
| 23
|
Syria–.svg.png) Lebanon Lebanon
|
3,577
|
0.18%
|
0.03%
|
—
|
| 24
|
Australia
|
2,813
|
0.14%
|
0.02%
|
—
|
| 25
|
Other Europe
|
2,612
|
0.13%
|
0.02%
|
—
|
| 26
|
South Africa
|
2,109
|
0.1%
|
0.02%
|
—
|
| 27
|
South America
|
1,472
|
0.07%
|
0.01%
|
—
|
| 28
|
Bulgaria
|
1,182
|
0.06%
|
0.01%
|
—
|
| 29
|
Turkey
|
1,093
|
0.05%
|
0.01%
|
—
|
| 30
|
Other Asia
|
688
|
0.03%
|
0.01%
|
—
|
| 31
|
At Sea
|
598
|
0.03%
|
0.01%
|
—
|
| 32
|
Armenia
|
528
|
0.03%
|
0%
|
—
|
| 33
|
.svg.png) Spain Spain
|
511
|
0.03%
|
0%
|
—
|
| 34
|
Other countries & Not stated
|
3,512
|
0.17%
|
0.03%
|
Other Countries: 2,040 / Not Stated: 945
|
| —
|
Total immigrants
|
2,018,847
|
100%
|
17.55%
|
—
|
1931 census
The 1931 census reported that immigrants comprised 2,307,525 individuals or 22.4 percent of the total Canadian population. Of the total immigrant population, the top countries of origin were United Kingdom (1,031,398 persons or 44.7%), United States (344,574 persons or 14.9%), Poland & Soviet Union (305,038 persons or 13.2%), Scandinavia (120,396 persons or 5.2%), Ireland (107,544 persons or 4.7%), Austria & Germany (76,554 persons or 3.3%), Italy (42,578 persons or 1.9%), China (42,037 persons or 1.8%), Romania (40,322 persons or 1.8%), and Hungary (28,523 persons or 1.2%).[39][40]: 9 [47]: 540 [48]: 710 [49]: 446 [50]: 374
Additionally, according to the 1931 census, the Canadian population with at least one foreign born parent (first and second generation persons) numbered 4,744,091 people, forming 45.7 percent of the total Canadian population.[47]: 606 & 659
Total immigrant population by country of birth, 1931 Canadian census[39][40]: 9 [47]: 540 [48]: 710 [49]: 446 [50]: 374
Immigrant refers to all those who hold or have ever held permanent resident status in Canada, including naturalized citizens.
| Rank
|
Country of birth
|
Immigrant population
|
Proportion of immigrants in Canada
|
Proportion of Canadian population
|
Notes
|
| —
|
Canada
|
2,307,525
|
100%
|
22.24%
|
—
|
| 1
|
United Kingdom
|
1,031,398
|
44.7%
|
9.94%
|
England: 723,864 / Scotland: 279,765 / Wales: 22,348 / Lesser Isles: 5,421
|
| 2
|
United States
|
344,574
|
14.93%
|
3.32%
|
—
|
| 3
|
.svg.png) Poland & Soviet Union Poland & Soviet Union
|
305,038
|
13.22%
|
2.94%
|
Poland: 171,169 / .svg.png) Russian SFSR: 114,406 / Russian SFSR: 114,406 / .svg.png) Ukrainian SSR: 13,759 / Lithuanian SSR: 5,704 Ukrainian SSR: 13,759 / Lithuanian SSR: 5,704
|
| 4
|
Scandinavia
|
120,396
|
5.22%
|
1.16%
|
Sweden: 34,415 / Norway: 32,679 / Finland: 30,354 / Denmark: 17,217 / Iceland: 5,731
|
| 5
|
Ireland
|
107,544
|
4.66%
|
1.04%
|
Also includes Northern Ireland.
|
| 6
|
.svg.png) Germany & Germany & .svg.png) Austria Austria
|
76,554
|
3.32%
|
0.74%
|
Germany: 39,163 / Austria: 37,391
|
| 7
|
Italy
|
42,578
|
1.85%
|
0.41%
|
—
|
| 8
|
China
|
42,037
|
1.82%
|
0.41%
|
—
|
| 9
|
Romania
|
40,322
|
1.75%
|
0.39%
|
—
|
| 10
|
Hungary
|
28,523
|
1.24%
|
0.27%
|
—
|
| 11
|
Newfoundland
|
26,410
|
1.14%
|
0.25%
|
—
|
| 12
|
Czechoslovakia
|
22,835
|
0.99%
|
0.22%
|
—
|
| 13
|
Yugoslavia
|
17,110
|
0.74%
|
0.16%
|
—
|
| 14
|
Belgium
|
17,033
|
0.74%
|
0.16%
|
—
|
| 15
|
France
|
16,756
|
0.73%
|
0.16%
|
—
|
| 16
|
Japan
|
12,261
|
0.53%
|
0.12%
|
—
|
| 17
|
Netherlands
|
10,736
|
0.47%
|
0.1%
|
—
|
| 18
|
Switzerland
|
6,076
|
0.26%
|
0.06%
|
—
|
| 19
|
Greece
|
5,579
|
0.24%
|
0.05%
|
—
|
| 20
|
India
|
4,672
|
0.2%
|
0.05%
|
—
|
| 21
|
British West Indies
|
4,537
|
0.2%
|
0.04%
|
—
|
| 22
|
 Syria–Lebanon Syria–Lebanon
|
3,953
|
0.17%
|
0.04%
|
—
|
| 23
|
Australia
|
3,565
|
0.15%
|
0.03%
|
—
|
| 24
|
Other Europe
|
2,887
|
0.13%
|
0.03%
|
—
|
| 25
|
Other British Commonwealth
|
2,304
|
0.1%
|
0.02%
|
—
|
| 26
|
South Africa
|
2,235
|
0.1%
|
0.02%
|
—
|
| 27
|
Bulgaria
|
1,467
|
0.06%
|
0.01%
|
—
|
| 28
|
New Zealand
|
1,434
|
0.06%
|
0.01%
|
—
|
| 29
|
South America
|
1,296
|
0.06%
|
0.01%
|
—
|
| 30
|
Turkey
|
921
|
0.04%
|
0.01%
|
—
|
| 31
|
Other Asia
|
803
|
0.03%
|
0.01%
|
—
|
| 32
|
At Sea
|
731
|
0.03%
|
0.01%
|
—
|
| 33
|
Armenia
|
633
|
0.03%
|
0.01%
|
—
|
| 34
|
.svg.png) Spain Spain
|
572
|
0.02%
|
0.01%
|
—
|
| 35
|
Other countries
|
1,755
|
0.08%
|
0.02%
|
—
|
| —
|
Total immigrants
|
2,307,525
|
100%
|
22.24%
|
—
|
1921 census
According to the 1921 census, the Canadian population with at least one foreign born parent (first and second generation persons) numbered 3,903,117 people, forming 44.4 percent of the total Canadian population.[51]: 253
Total immigrant population by country of birth, 1921 Canadian census[39][40]: 9 [51]: 238 & 294
Immigrant refers to all those who hold or have ever held permanent resident status in Canada, including naturalized citizens.
| Rank
|
Country of birth
|
Immigrant population
|
Proportion of immigrants in Canada
|
Proportion of Canadian population
|
Notes
|
| —
|
Canada
|
1,955,736
|
100%
|
22.25%
|
—
|
| 1
|
United Kingdom
|
931,820
|
47.65%
|
10.6%
|
England: 686,663 / Scotland: 226,483 / Wales: 13,779 / Lesser Isles: 4,807 /
British Isles not stated: 88
|
| 2
|
United States
|
373,024
|
19.07%
|
4.24%
|
—
|
| 3
|
Soviet Union & .svg.png) Poland Poland
|
177,716
|
9.09%
|
2.02%
|
Russian SFSR: 101,055 / Galicia: 36,025 / Poland: 29,279 / Ukrainian SSR: 11,357
|
| 4
|
Ireland
|
93,301
|
4.77%
|
1.06%
|
—
|
| 5
|
Germany & Austria
|
82,801
|
4.23%
|
0.94%
|
Austria: 57,535 / Germany: 25,266
|
| 6
|
Scandinavia
|
76,951
|
3.93%
|
0.88%
|
Sweden: 27,700 / Norway: 23,127 / Finland: 12,156 / Denmark: 7,192 / Iceland: 6,776
|
| 7
|
.svg.png) China China
|
36,924
|
1.89%
|
0.42%
|
—
|
| 8
|
Italy
|
35,531
|
1.82%
|
0.4%
|
—
|
| 9
|
Newfoundland
|
23,107
|
1.18%
|
0.26%
|
—
|
| 10
|
Romania
|
22,779
|
1.16%
|
0.26%
|
—
|
| 11
|
France
|
19,249
|
0.98%
|
0.22%
|
—
|
| 12
|
Belgium
|
13,276
|
0.68%
|
0.15%
|
—
|
| 13
|
Japan
|
11,650
|
0.6%
|
0.13%
|
—
|
| 14
|
Hungary
|
7,493
|
0.38%
|
0.09%
|
—
|
| 15
|
Netherlands
|
5,828
|
0.3%
|
0.07%
|
—
|
| 16
|
West Indies
|
4,393
|
0.22%
|
0.05%
|
British West Indies: 4,270 / Other West Indies: 123
|
| 17
|
Czechoslovakia
|
4,322
|
0.22%
|
0.05%
|
—
|
| 18
|
.svg.png) Ottoman Empire Ottoman Empire
|
4,280
|
0.22%
|
0.05%
|
Syria–Lebanon: 3,879 / Turkey: 401
|
| 19
|
India
|
3,848
|
0.2%
|
0.04%
|
—
|
| 20
|
Greece
|
3,769
|
0.19%
|
0.04%
|
—
|
| 21
|
Switzerland
|
3,479
|
0.18%
|
0.04%
|
—
|
| 22
|
Other Europe
|
3,183
|
0.16%
|
0.04%
|
—
|
| 23
|
Australia
|
2,855
|
0.15%
|
0.03%
|
—
|
| 24
|
Other British Empire
|
2,755
|
0.14%
|
0.03%
|
—
|
| 25
|
Yugoslavia
|
1,946
|
0.1%
|
0.02%
|
—
|
| 26
|
South Africa
|
1,760
|
0.09%
|
0.02%
|
—
|
| 27
|
New Zealand
|
1,085
|
0.06%
|
0.01%
|
—
|
| 28
|
Bulgaria
|
1,005
|
0.05%
|
0.01%
|
—
|
| 29
|
Other Asia
|
782
|
0.04%
|
0.01%
|
—
|
| 30
|
At Sea
|
653
|
0.03%
|
0.01%
|
—
|
| 31
|
Other countries
|
3,171
|
0.16%
|
0.04%
|
—
|
| —
|
Total immigrants
|
1,955,736
|
100%
|
22.25%
|
—
|
1911 census
Total immigrant population by country of birth, 1911 Canadian census[39][52]: 440 & 444
Immigrant refers to all those who hold or have ever held permanent resident status in Canada, including naturalized citizens.
| Rank
|
Country of birth
|
Immigrant population
|
Proportion of immigrants in Canada
|
Proportion of Canadian population
|
Notes
|
| —
|
.svg.png) Canada Canada
|
1,586,961
|
100%
|
22.02%
|
—
|
| 1
|
United Kingdom
|
711,360
|
44.83%
|
9.87%
|
England: 510,674 / Scotland: 169,391 / Wales: 8,727 / Lesser Isles: 2,860 /
British Isles not stated: 19,708
|
| 2
|
United States
|
303,680
|
19.14%
|
4.21%
|
—
|
| 3
|
.svg.png) Austria–Hungary Austria–Hungary
|
121,430
|
7.65%
|
1.68%
|
Austria: 67,502 / Galicia: 31,373 / Hungary: 10,586 / Bukovina: 10,280 /  Bohemia: 1,689 Bohemia: 1,689
|
| 4
|
Ireland
|
92,874
|
5.85%
|
1.29%
|
—
|
| 5
|
Russian Empire
|
89,984
|
5.67%
|
1.25%
|
—
|
| 6
|
Scandinavia
|
72,227
|
4.55%
|
1%
|
Sweden: 28,226 / Norway: 20,968 / Finland: 10,987 / Iceland: 7,109 / Denmark: 4,937
|
| 7
|
.svg.png) German Empire & Netherlands German Empire & Netherlands
|
43,385
|
2.73%
|
0.6%
|
Germany: 39,577 / Netherlands: 3,808
|
| 8
|
Italy
|
34,739
|
2.19%
|
0.48%
|
—
|
| 9
|
China
|
27,083
|
1.71%
|
0.38%
|
—
|
| 10
|
France
|
17,619
|
1.11%
|
0.24%
|
—
|
| 11
|
Newfoundland
|
15,469
|
0.97%
|
0.21%
|
—
|
| 12
|
Bulgaria & Romania
|
9,657
|
0.61%
|
0.13%
|
—
|
| 13
|
Japan
|
8,425
|
0.53%
|
0.12%
|
—
|
| 14
|
Belgium
|
7,975
|
0.5%
|
0.11%
|
—
|
| 15
|
Other Europe
|
5,285
|
0.33%
|
0.07%
|
—
|
| 16
|
Ottoman Empire
|
4,768
|
0.3%
|
0.07%
|
Syria–Lebanon: 2,907 / Turkey: 1,861
|
| 17
|
India
|
4,491
|
0.28%
|
0.06%
|
—
|
| 18
|
Australia
|
2,655
|
0.17%
|
0.04%
|
—
|
| 19
|
Other British Empire
|
2,626
|
0.17%
|
0.04%
|
—
|
| 20
|
Greece
|
2,640
|
0.17%
|
0.04%
|
—
|
| 21
|
West Indies
|
2,089
|
0.13%
|
0.03%
|
British West Indies: 1,878 / Other West Indies: 211
|
| 22
|
South Africa
|
1,166
|
0.07%
|
0.02%
|
—
|
| 23
|
New Zealand
|
903
|
0.06%
|
0.01%
|
—
|
| 24
|
At Sea
|
807
|
0.05%
|
0.01%
|
—
|
| 25
|
Other Asia
|
523
|
0.03%
|
0.01%
|
—
|
| 26
|
Africa
|
223
|
0.01%
|
0%
|
—
|
| 27
|
East Indies
|
147
|
0.01%
|
0%
|
—
|
| 28
|
Other countries
|
2,731
|
0.17%
|
0.04%
|
—
|
| —
|
Total immigrants
|
1,586,961
|
100%
|
22.02%
|
—
|
1901 census
Total immigrant population by country of birth, 1901 Canadian census[39][53]: 416
Immigrant refers to all those who hold or have ever held permanent resident status in Canada, including naturalized citizens.
| Rank
|
Country of birth
|
Immigrant population
|
Proportion of immigrants in Canada
|
Proportion of Canadian population
|
Notes
|
| —
|
Canada
|
699,500
|
100%
|
13.02%
|
—
|
| 1
|
United Kingdom
|
288,390
|
41.23%
|
5.37%
|
England: 201,285 / Scotland: 83,631 / Wales: 2,518 / Lesser Isles: 956
|
| 2
|
United States
|
127,899
|
18.28%
|
2.38%
|
—
|
| 3
|
Ireland
|
101,629
|
14.53%
|
1.89%
|
—
|
| 4
|
Russian Empire & Finland
|
31,231
|
4.46%
|
0.58%
|
—
|
| 5
|
Austria–Hungary
|
28,407
|
4.06%
|
0.53%
|
—
|
| 6
|
German Empire & Netherlands
|
27,685
|
3.96%
|
0.52%
|
Germany: 27,300 / Netherlands: 385
|
| 7
|
Scandinavia
|
18,388
|
2.63%
|
0.34%
|
Norway & Sweden: 10,256 / Iceland: 6,057 / Denmark: 2,075
|
| 8
|
China
|
17,043
|
2.44%
|
0.32%
|
—
|
| 9
|
Newfoundland
|
12,432
|
1.78%
|
0.23%
|
—
|
| 10
|
France
|
7,944
|
1.14%
|
0.15%
|
—
|
| 11
|
Italy
|
6,854
|
0.98%
|
0.13%
|
—
|
| 12
|
Japan
|
4,674
|
0.67%
|
0.09%
|
—
|
| 13
|
Belgium
|
2,280
|
0.33%
|
0.04%
|
—
|
| 14
|
Ottoman Empire
|
1,579
|
0.23%
|
0.03%
|
Syria–Lebanon: 1,222 / Turkey: 357
|
| 15
|
Switzerland
|
1,211
|
0.17%
|
0.02%
|
—
|
| 16
|
India
|
1,076
|
0.15%
|
0.02%
|
—
|
| 17
|
Romania
|
1,066
|
0.15%
|
0.02%
|
—
|
| 18
|
Australia
|
991
|
0.14%
|
0.02%
|
—
|
| 19
|
Other British Empire
|
863
|
0.12%
|
0.02%
|
—
|
| 20
|
West Indies
|
699
|
0.1%
|
0.01%
|
—
|
| 21
|
New Zealand
|
374
|
0.05%
|
0.01%
|
—
|
| 22
|
At Sea
|
339
|
0.05%
|
0.01%
|
—
|
| 23
|
Spain & Portugal
|
270
|
0.04%
|
0.01%
|
—
|
| 24
|
Greece
|
213
|
0.03%
|
0%
|
—
|
| 25
|
East Indies
|
188
|
0.03%
|
0%
|
—
|
| 26
|
South Africa
|
128
|
0.02%
|
0%
|
—
|
| 27
|
Other countries & Not given
|
15,647
|
2.24%
|
0.29%
|
Other countries: 818 / Not given: 14,829
|
| —
|
Total immigrants
|
699,500
|
100%
|
13.02%
|
—
|
1891 census
According to the 1891 census, the Canadian population with at least one foreign born parent (first and second generation persons) numbered 1,768,946 people, forming 36.6 percent of the total Canadian population.[54]: 228
Total immigrant population by country of birth, 1891 Canadian census[39][55]: 363
Immigrant refers to all those who hold or have ever held permanent resident status in Canada, including naturalized citizens.
| Rank
|
Country of birth
|
Immigrant population
|
Proportion of immigrants in Canada
|
Proportion of Canadian population
|
Notes
|
| —
|
Canada
|
643,871
|
100%
|
13.32%
|
—
|
| —
|
Total immigrants
|
643,871
|
100%
|
13.32%
|
—
|
1881 census
Total immigrant population by country of birth, 1881 Canadian census[39]
Immigrant refers to all those who hold or have ever held permanent resident status in Canada, including naturalized citizens.
| Rank
|
Country of birth
|
Immigrant population
|
Proportion of immigrants in Canada
|
Proportion of Canadian population
|
Notes
|
| —
|
Canada
|
602,984
|
100%
|
13.94%
|
—
|
| —
|
Total immigrants
|
602,984
|
100%
|
13.94%
|
—
|
1871 census
Total immigrant population by country of birth, 1871 Canadian census[39]
Immigrant refers to all those who hold or have ever held permanent resident status in Canada, including naturalized citizens.
| Rank
|
Country of birth
|
Immigrant population
|
Proportion of immigrants in Canada
|
Proportion of Canadian population
|
Notes
|
| —
|
Canada
|
594,207
|
100%
|
16.11%
|
—
|
| —
|
Total immigrants
|
594,207
|
100%
|
16.11%
|
—
|
1861 census
Total immigrant population by country of birth
(1861 censuses of Upper Canada, Lower Canada, New Brunswick, and Nova Scotia)[56]: 258+288+335+346 [57][58][a]
| Rank
|
Country of birth
|
Immigrant population
|
Proportion of immigrants in Canada
|
Proportion of Canadian population
|
Notes
|
| —
|
Canada[a]
|
687,967
|
100%
|
22.26%
|
British North American territory (Upper Canada, Lower Canada, New Brunswick, and Nova Scotia) that comprised the Dominion of Canada following Canadian Confederation in 1867.
|
| 1
|
Ireland
|
281,060
|
41.35%
|
9.09%
|
—
|
| 2
|
United Kingdom
|
269,058
|
39.59%
|
8.71%
|
England & Wales: 135,468 / Scotland: 133,590
|
| 3
|
United States
|
66,356
|
9.76%
|
2.15%
|
—
|
| 4
|
Other British Empire
|
25,692
|
3.78%
|
0.83%
|
—
|
| 5
|
 Germany & Netherlands Germany & Netherlands
|
23,800
|
3.5%
|
0.77%
|
Also includes .svg.png) Prussia. Prussia.
|
| 6
|
France
|
13,421
|
1.97%
|
0.43%
|
—
|
| 7
|
Scandinavia
|
506
|
0.07%
|
0.02%
|
—
|
| 8
|
At sea
|
424
|
0.06%
|
0.01%
|
—
|
| 9
|
_crowned.svg.png) Italy & Greece Italy & Greece
|
233
|
0.03%
|
0.01%
|
—
|
| 10
|
.svg.png) Russian Empire Russian Empire
|
221
|
0.03%
|
0.01%
|
Also includes .svg.png) Poland. Poland.
|
| 11
|
.svg.png) Spain & Spain & .svg.png) Portugal Portugal
|
171
|
0.03%
|
0.01%
|
—
|
| 12
|
Austria–Hungary
|
1
|
0%
|
0%
|
—
|
| 13
|
Other countries & Not given
|
7,024
|
1.03%
|
0.23%
|
Other countries: 5,216 / Not given: 1,808
|
| —
|
Total immigrants
|
687,967
|
100%
|
22.26%
|
—
|
1851 census
Total immigrant population by country of birth
(1851 censuses of Upper Canada, Lower Canada & New Brunswick)[56]: 182+206 [47]: 517 [b]
| Rank
|
Country of birth
|
Immigrant population
|
Proportion of immigrants in Canada
|
Proportion of Canadian population
|
Notes
|
| —
|
Province of Canada & New Brunswick[b]
|
535,153
|
100%
|
26.28%
|
Province of Canada territory (Upper Canada & Lower Canada) and New Brunswick.
|
| 1
|
Ireland
|
256,238
|
47.88%
|
12.58%
|
—
|
| 2
|
United Kingdom
|
193,067
|
36.08%
|
9.48%
|
England / Wales: 97,836
Scotland: 95,231
|
| 3
|
United States
|
56,214
|
10.5%
|
2.76%
|
—
|
| 4
|
Other British Empire
|
10,120
|
1.89%
|
0.5%
|
—
|
| 5
|
Germany & Netherlands
|
10,097
|
1.89%
|
0.5%
|
—
|
| 6
|
France
|
1,366
|
0.26%
|
0.07%
|
—
|
| 7
|
Russian Empire
|
196
|
0.04%
|
0.01%
|
Also includes Poland & Prussia.
|
| 8
|
At sea
|
177
|
0.03%
|
0.01%
|
—
|
| 9
|
Spain & Portugal
|
72
|
0.01%
|
0%
|
—
|
| 10
|
Scandinavia
|
44
|
0.01%
|
0%
|
—
|
| 11
|
.svg.png) Italy & Greece Italy & Greece
|
43
|
0.01%
|
0%
|
—
|
| 12
|
Austria–Hungary
|
12
|
0%
|
0%
|
—
|
| 13
|
Other countries & Not given
|
7,507
|
1.4%
|
0.37%
|
Other countries: 3,787 / Not given: 3,720
|
| —
|
Total immigrants
|
535,153
|
100%
|
26.28%
|
—
|
Annual sources of immigration
2020s
During the 2020s (up to March 2025/Q1), 2,087,855 immigrants have arrived in Canada. Furthermore, the top five source countries for immigrants to Canada during the 2020s include India (587,870 persons or 28.2 percent), China (147,430 persons or 7.06 percent), Philippines (117,530 persons or 5.63 percent), Nigeria (86,520 persons or 4.14 percent), and Afghanistan (68,185 persons or 3.27 percent).[3][4]
Between March 17, 2022 and April 1, 2024, 298,128 Ukrainians arrived in Canada, the vast majority of whom were not counted in the official immigration statistics for each calendar year, instead arriving under temporary resident visas.[59][60][61]
2010s
During the 2010s, 2,823,572 immigrants arrived in Canada. Furthermore, the top five source countries for immigrants to Canada during the 2010 included India (450,257 persons or 16.0 percent), Philippines (375,703 persons or 13.3 percent), China (287,084 persons or 10.2 percent), Pakistan (97,801 persons or 3.46 percent), and the United States (87,623 persons or 3.10 percent).[3][4]
1970s
Permanent Residents admitted in 1974 by source countries & regions[7][8][9][10][39]
| Rank
|
Country
|
Number
|
Percentage
|
| 1
|
United Kingdom[d]
|
38,456
|
17.6%
|
| 2
|
United States
|
26,541
|
12.15%
|
| 3
|
Caribbean
|
23,885
|
10.93%
|
| 4
|
Portugal
|
16,333
|
7.48%
|
| 5
|
India
|
12,868
|
5.89%
|
| 6
|
Hong Kong
|
12,704
|
5.82%
|
| 7
|
South America
|
12,528
|
5.73%
|
| 8
|
Other Asia
|
9,884
|
4.52%
|
| 9
|
Philippines
|
9,564
|
4.38%
|
| 10
|
Other Europe
|
8,557
|
3.92%
|
| 11
|
Other Africa
|
8,368
|
3.83%
|
| 12
|
Greece
|
5,632
|
2.58%
|
| 13
|
Italy
|
5,226
|
2.39%
|
| 14
|
France
|
4,232
|
1.94%
|
| 15
|
West Germany
|
3,619
|
1.66%
|
| 16
|
Yugoslavia
|
3,200
|
1.46%
|
| 17
|
.svg.png) Australasia Australasia
|
2,594
|
1.19%
|
| 18
|
Pakistan
|
2,315
|
1.06%
|
| 19
|
Netherlands
|
2,103
|
0.96%
|
| 20
|
Lebanon
|
1,762
|
0.81%
|
| 21
|
Central America
|
1,391
|
0.64%
|
| 22
|
Switzerland
|
1,336
|
0.61%
|
| 23
|
South Africa
|
1,154
|
0.53%
|
| 24
|
Israel
|
1,090
|
0.5%
|
| 25
|
Egypt
|
928
|
0.42%
|
| 26
|
China
|
379
|
0.17%
|
| 27
|
Others[e]
|
1,816
|
0.83%
|
|
|
Total
|
218,465
|
100%
|
Permanent Residents admitted in 1973 by source countries & regions[7][8][9][10][39]
| Rank
|
Country
|
Number
|
Percentage
|
| 1
|
United Kingdom[d]
|
26,973
|
14.64%
|
| 2
|
United States
|
25,242
|
13.7%
|
| 3
|
Caribbean
|
19,563
|
10.62%
|
| 4
|
Hong Kong
|
14,662
|
7.96%
|
| 5
|
Portugal
|
13,483
|
7.32%
|
| 6
|
South America
|
11,057
|
6%
|
| 7
|
India
|
9,203
|
5%
|
| 8
|
Other Europe
|
8,252
|
4.48%
|
| 9
|
Other Asia
|
7,917
|
4.3%
|
| 10
|
Philippines
|
6,757
|
3.67%
|
| 11
|
Other Africa
|
6,636
|
3.6%
|
| 12
|
Greece
|
5,833
|
3.17%
|
| 13
|
Italy
|
5,468
|
2.97%
|
| 14
|
France
|
3,586
|
1.95%
|
| 15
|
Yugoslavia
|
2,873
|
1.56%
|
| 16
|
Australasia
|
2,671
|
1.45%
|
| 17
|
West Germany
|
2,564
|
1.39%
|
| 18
|
Pakistan
|
2,285
|
1.24%
|
| 19
|
Netherlands
|
1,898
|
1.03%
|
| 20
|
Lebanon
|
1,325
|
0.72%
|
| 21
|
Central America
|
1,141
|
0.62%
|
| 22
|
Israel
|
984
|
0.53%
|
| 23
|
Switzerland
|
953
|
0.52%
|
| 24
|
Egypt
|
905
|
0.49%
|
| 25
|
South Africa
|
766
|
0.42%
|
| 26
|
China
|
60
|
0.03%
|
| 27
|
Others[e]
|
1,143
|
0.62%
|
|
|
Total
|
184,200
|
100%
|
Permanent Residents admitted in 1972 by source countries & regions[7][8][9][10][39]
| Rank
|
Country
|
Number
|
Percentage
|
| 1
|
United States
|
22,618
|
18.54%
|
| 2
|
United Kingdom[d]
|
18,197
|
14.91%
|
| 3
|
Portugal
|
8,737
|
7.16%
|
| 4
|
Caribbean
|
8,353
|
6.85%
|
| 5
|
Other Africa
|
7,262
|
5.95%
|
| 6
|
Other Europe
|
6,672
|
5.47%
|
| 7
|
Hong Kong
|
6,297
|
5.16%
|
| 8
|
Other Asia
|
5,202
|
4.26%
|
| 9
|
India
|
5,049
|
4.14%
|
| 10
|
Italy
|
4,608
|
3.78%
|
| 11
|
South America
|
4,309
|
3.53%
|
| 12
|
Greece
|
4,016
|
3.29%
|
| 13
|
Philippines
|
3,946
|
3.23%
|
| 14
|
France
|
2,742
|
2.25%
|
| 15
|
Australasia
|
2,143
|
1.76%
|
| 16
|
Yugoslavia
|
2,047
|
1.68%
|
| 17
|
West Germany
|
2,025
|
1.66%
|
| 18
|
Netherlands
|
1,471
|
1.21%
|
| 19
|
Pakistan
|
1,190
|
0.98%
|
| 20
|
Lebanon
|
996
|
0.82%
|
| 21
|
Central America
|
865
|
0.71%
|
| 22
|
Switzerland
|
778
|
0.64%
|
| 23
|
Israel
|
620
|
0.51%
|
| 24
|
Egypt
|
606
|
0.5%
|
| 25
|
South Africa
|
440
|
0.36%
|
| 26
|
China
|
25
|
0.02%
|
| 27
|
Others[e]
|
792
|
0.65%
|
|
|
Total
|
122,006
|
100%
|
Permanent Residents admitted in 1971 by source countries & regions[7][8][9][10][39]
| Rank
|
Country
|
Number
|
Percentage
|
| 1
|
United States
|
24,366
|
19.99%
|
| 2
|
United Kingdom[d]
|
15,451
|
12.68%
|
| 3
|
Caribbean
|
11,017
|
9.04%
|
| 4
|
Portugal
|
9,157
|
7.51%
|
| 5
|
Other Europe
|
6,301
|
5.17%
|
| 6
|
Italy
|
5,790
|
4.75%
|
| 7
|
India
|
5,313
|
4.36%
|
| 8
|
Other Asia
|
5,126
|
4.21%
|
| 9
|
South America
|
5,058
|
4.15%
|
| 10
|
Hong Kong
|
5,009
|
4.11%
|
| 11
|
Greece
|
4,769
|
3.91%
|
| 12
|
Philippines
|
4,180
|
3.43%
|
| 13
|
Yugoslavia
|
2,997
|
2.46%
|
| 14
|
France
|
2,966
|
2.43%
|
| 15
|
Australasia
|
2,902
|
2.38%
|
| 16
|
West Germany
|
2,275
|
1.87%
|
| 17
|
Other Africa
|
1,382
|
1.13%
|
| 18
|
Netherlands
|
1,301
|
1.07%
|
| 19
|
Switzerland
|
1,024
|
0.84%
|
| 20
|
Pakistan
|
968
|
0.79%
|
| 21
|
Lebanon
|
928
|
0.76%
|
| 22
|
Egypt
|
730
|
0.6%
|
| 23
|
South Africa
|
729
|
0.6%
|
| 24
|
Central America
|
636
|
0.52%
|
| 25
|
Israel
|
600
|
0.49%
|
| 26
|
China
|
47
|
0.04%
|
| 27
|
Others[e]
|
878
|
0.72%
|
|
|
Total
|
121,900
|
100%
|
Permanent Residents admitted in 1970 by source countries & regions[7][8][9][10][39]
| Rank
|
Country
|
Number
|
Percentage
|
| 1
|
United Kingdom[d]
|
26,497
|
17.94%
|
| 2
|
United States
|
24,424
|
16.53%
|
| 3
|
Caribbean
|
12,660
|
8.57%
|
| 4
|
Italy
|
8,533
|
5.78%
|
| 5
|
Other Europe
|
8,061
|
5.46%
|
| 6
|
Portugal
|
7,902
|
5.35%
|
| 7
|
Greece
|
6,327
|
4.28%
|
| 8
|
Yugoslavia
|
5,672
|
3.84%
|
| 9
|
India
|
5,670
|
3.84%
|
| 10
|
China & Hong Kong
|
5,377
|
3.64%
|
| 11
|
South America
|
4,943
|
3.35%
|
| 12
|
France
|
4,410
|
2.99%
|
| 13
|
Australasia
|
4,385
|
2.97%
|
| 14
|
West Germany
|
4,193
|
2.84%
|
| 15
|
Other Asia
|
3,849
|
2.61%
|
| 16
|
Philippines
|
3,240
|
2.19%
|
| 17
|
Switzerland
|
2,098
|
1.42%
|
| 18
|
Netherlands
|
1,916
|
1.3%
|
| 19
|
Other Africa
|
1,304
|
0.88%
|
| 20
|
Lebanon
|
1,206
|
0.82%
|
| 21
|
Pakistan
|
1,010
|
0.68%
|
| 22
|
Egypt
|
913
|
0.62%
|
| 23
|
Israel
|
818
|
0.55%
|
| 24
|
Central America
|
711
|
0.48%
|
| 25
|
South Africa
|
646
|
0.44%
|
| 26
|
Others[e]
|
948
|
0.64%
|
|
|
Total
|
147,713
|
100%
|
1960s
During the 1960s, 1,366,840 immigrants arrived in Canada. The continental breakdown for immigrants to Canada during this time included Europe (966,450 persons or 70.7 percent), North America (202,343 persons or 14.8 percent), Asia (109,770 persons or 8.03 percent), Oceania (30,630 persons or 2.24 percent), Africa (29,178 persons or 2.13 percent), South America (25,888 persons or 1.89 percent), and Other/Not stated (2,581 persons or 0.19 percent). Furthermore, during the 1960s, the top three source countries for immigrants to Canada included the United Kingdom (336,374 persons or 24.6 percent), Italy (200,442 persons or 14.7 percent), and the United States (153,609 persons or 11.2 percent).
1950s
During the 1950s, 1,544,642 immigrants arrived in Canada. Furthermore, the top five source countries for immigrants to Canada during the 1950s included the United Kingdom (380,984 persons or 24.7 percent), Italy (234,369 persons or 15.2 percent), Germany & Austria (213,653 persons or 13.8 percent) Netherlands (120,757 persons or 7.82 percent), and Poland & the Soviet Union (92,986 persons or 6.02 percent).[70][71][72][73]
1940s
During the 1940s, 428,733 immigrants arrived in Canada. Furthermore, the top five source countries for immigrants to Canada during the 1940s included the United Kingdom (162,082 persons or 37.8 percent), Poland & the Soviet Union (76,777 persons or 17.9 percent), United States (52,604 persons or 12.3 percent), Netherlands (18,729 persons or 4.37 percent), and Italy (11,300 persons or 2.64 percent).[74][75][76][77]
1920s
Immigrant arrivals in Canada by nationality (1921 fiscal year)[78][80][79]
| Country
|
Number
|
Percentage
|
| United Kingdom[d]
|
67,878
|
45.9%
|
| United States
|
48,169
|
32.58%
|
| Ireland
|
6,384
|
4.32%
|
| Poland
|
5,061
|
3.42%
|
| Italy
|
3,880
|
2.62%
|
| Scandinavia[f]
|
3,106
|
2.1%
|
| Soviet Union
|
2,730
|
1.85%
|
| China
|
2,435
|
1.65%
|
| Belgium
|
1,645
|
1.11%
|
| Newfoundland
|
1,042
|
0.7%
|
| Romania
|
969
|
0.66%
|
| France
|
861
|
0.58%
|
| Netherlands
|
595
|
0.4%
|
| Japan
|
532
|
0.36%
|
| Ottoman Empire[g]
|
451
|
0.3%
|
| Greece
|
357
|
0.24%
|
| Czechoslovakia
|
308
|
0.21%
|
| Switzerland
|
235
|
0.16%
|
| Spain
|
202
|
0.14%
|
| Africa
|
144
|
0.1%
|
.svg.png) Malta Malta
|
140
|
0.09%
|
| Germany
|
137
|
0.09%
|
| Caribbean
|
136
|
0.09%
|
| Australia
|
90
|
0.06%
|
| Yugoslavia
|
89
|
0.06%
|
| Armenia
|
85
|
0.06%
|
.svg.png) South Africa South Africa
|
63
|
0.04%
|
| Austria– Hungary[h]
|
50
|
0.03%
|
| New Zealand
|
40
|
0.03%
|
| Luxemburg
|
16
|
0.01%
|
| India
|
10
|
0.01%
|
.svg.png) Egypt Egypt
|
9
|
0.01%
|
| Bulgaria
|
4
|
0%
|
| Portugal
|
4
|
0%
|
.svg.png) Persia Persia
|
1
|
0%
|
| Others
|
11
|
0.01%
|
| Total
|
147,869[i]
|
100%
|
1910s
Immigrant arrivals in Canada by nationality (1915 fiscal year)[81][78][80][79]
| Country
|
Number
|
Percentage
|
| United States
|
59,820
|
41.32%
|
| United Kingdom[d]
|
39,751
|
27.45%
|
| Russian Empire[j]
|
8,844
|
6.11%
|
| Austria–Hungary[h]
|
8,582
|
5.93%
|
| Italy
|
6,228
|
4.3%
|
| Bulgaria
|
4,048
|
2.8%
|
| Ireland
|
3,525
|
2.43%
|
| Scandinavia[f]
|
2,634
|
1.82%
|
| German Empire
|
2,472
|
1.71%
|
| China
|
1,258
|
0.87%
|
| France
|
1,206
|
0.83%
|
| Belgium
|
1,149
|
0.79%
|
| Greece
|
1,147
|
0.79%
|
| Spain
|
755
|
0.52%
|
| Netherlands
|
605
|
0.42%
|
| Japan
|
592
|
0.41%
|
| Caribbean
|
390
|
0.27%
|
| Newfoundland
|
338
|
0.23%
|
| Romania
|
361
|
0.25%
|
| Yugoslavia
|
220
|
0.15%
|
| Switzerland
|
209
|
0.14%
|
| Africa
|
202
|
0.14%
|
| Macedonia
|
132
|
0.09%
|
| Ottoman Empire[g]
|
112
|
0.08%
|
| Australia
|
51
|
0.04%
|
| Armenia
|
36
|
0.02%
|
.svg.png) South Africa South Africa
|
23
|
0.02%
|
| New Zealand
|
21
|
0.01%
|
| Malta
|
19
|
0.01%
|
| Portugal
|
8
|
0.01%
|
| Persia
|
7
|
0%
|
| Others
|
44
|
0.03%
|
| Total
|
144,789[i]
|
100%
|
Immigrant arrivals in Canada by nationality (1914 fiscal year)[81][78][82]
| Country
|
Number
|
Percentage
|
| United Kingdom[d]
|
133,037
|
34.59%
|
| United States
|
107,651
|
27.99%
|
| Russian Empire[j]
|
58,798
|
15.29%
|
| Italy
|
24,722
|
6.43%
|
| Austria–Hungary[h]
|
12,265
|
3.19%
|
| Ireland
|
9,585
|
2.49%
|
| Scandinavia[f]
|
8,428
|
2.19%
|
| German Empire
|
5,591
|
1.45%
|
| China
|
5,512
|
1.43%
|
| France
|
2,683
|
0.7%
|
| Belgium
|
2,651
|
0.69%
|
| Bulgaria
|
1,727
|
0.45%
|
| Netherlands
|
1,506
|
0.39%
|
| Romania
|
1,504
|
0.39%
|
| Greece
|
1,102
|
0.29%
|
| Japan
|
856
|
0.22%
|
| Newfoundland
|
496
|
0.13%
|
| West Indies
|
474
|
0.12%
|
| Ottoman Empire[g]
|
465
|
0.12%
|
| Switzerland
|
269
|
0.07%
|
.svg.png) Serbia Serbia
|
193
|
0.05%
|
| Armenia
|
139
|
0.04%
|
| Australia
|
106
|
0.03%
|
| India
|
88
|
0.02%
|
| New Zealand
|
24
|
0.01%
|
| Others
|
5,006
|
1.3%
|
| Total
|
384,609[i]
|
100%
|
Immigrant arrivals in Canada by nationality (1913 fiscal year)[81][78][82]
| Country
|
Number
|
Percentage
|
| United Kingdom[d]
|
140,836
|
35.02%
|
| United States
|
139,130
|
34.59%
|
| Russian Empire[j]
|
48,476
|
12.05%
|
| Italy
|
16,601
|
4.13%
|
| Ireland
|
9,706
|
2.41%
|
| Scandinavia[f]
|
7,729
|
1.92%
|
| Austria–Hungary[h]
|
7,666
|
1.91%
|
| China
|
7,445
|
1.85%
|
| German Empire
|
4,983
|
1.24%
|
| Bulgaria
|
4,616
|
1.15%
|
| France
|
2,755
|
0.69%
|
| Belgium
|
1,826
|
0.45%
|
| Netherlands
|
1,524
|
0.38%
|
| Greece
|
1,390
|
0.35%
|
| Romania
|
1,116
|
0.28%
|
| Newfoundland
|
1,036
|
0.26%
|
| Ottoman Empire[g]
|
1,002
|
0.25%
|
| Japan
|
724
|
0.18%
|
| West Indies
|
398
|
0.1%
|
| Serbia
|
366
|
0.09%
|
| Switzerland
|
246
|
0.06%
|
| Australia
|
106
|
0.03%
|
| Armenia
|
100
|
0.02%
|
| New Zealand
|
39
|
0.01%
|
| India
|
5
|
0%
|
| Others
|
2,611
|
0.65%
|
| Total
|
402,186[i]
|
100%
|
Immigrant arrivals in Canada by nationality (1912 fiscal year)[81][78][82]
| Country
|
Number
|
Percentage
|
| United States
|
133,853
|
37.78%
|
| United Kingdom[d]
|
129,794
|
36.63%
|
| Russian Empire[j]
|
30,466
|
8.6%
|
| Austria–Hungary[h]
|
10,317
|
2.91%
|
| Ireland
|
8,327
|
2.35%
|
| Italy
|
7,590
|
2.14%
|
| China
|
6,581
|
1.86%
|
| Scandinavia[f]
|
6,565
|
1.85%
|
| German Empire
|
4,670
|
1.32%
|
| Bulgaria
|
3,295
|
0.93%
|
| Newfoundland
|
2,598
|
0.73%
|
| France
|
2,094
|
0.59%
|
| Belgium
|
1,601
|
0.45%
|
| Netherlands
|
1,077
|
0.3%
|
| Romania
|
793
|
0.22%
|
| Ottoman Empire[g]
|
776
|
0.22%
|
| Japan
|
765
|
0.22%
|
| Greece
|
693
|
0.2%
|
| West Indies
|
314
|
0.09%
|
| Switzerland
|
230
|
0.06%
|
| Serbia
|
209
|
0.06%
|
| Australia
|
184
|
0.05%
|
| New Zealand
|
61
|
0.02%
|
| Armenia
|
60
|
0.02%
|
| India
|
3
|
0%
|
| Others
|
1,655
|
0.47%
|
| Total
|
354,341[i]
|
100%
|
Immigrant arrivals in Canada by nationality (1911 fiscal year)[81][78][82]
| Country
|
Number
|
Percentage
|
| United States
|
121,654
|
39.14%
|
| United Kingdom[d]
|
116,136
|
37.37%
|
| Russian Empire[j]
|
15,438
|
4.97%
|
| Austria–Hungary[h]
|
14,213
|
4.57%
|
| Italy
|
8,359
|
2.69%
|
| Scandinavia[f]
|
8,299
|
2.67%
|
| Ireland
|
6,877
|
2.21%
|
.svg.png) China China
|
5,278
|
1.7%
|
| German Empire
|
2,592
|
0.83%
|
| Newfoundland
|
2,229
|
0.72%
|
| France
|
2,041
|
0.66%
|
| Belgium
|
1,563
|
0.5%
|
| Bulgaria
|
1,068
|
0.34%
|
| Netherlands
|
931
|
0.3%
|
| Greece
|
777
|
0.25%
|
| Ottoman Empire[g]
|
593
|
0.19%
|
| Romania
|
511
|
0.16%
|
| Japan
|
437
|
0.14%
|
| West Indies
|
398
|
0.13%
|
| Switzerland
|
270
|
0.09%
|
| Australia
|
266
|
0.09%
|
| New Zealand
|
116
|
0.04%
|
| Serbia
|
50
|
0.02%
|
| Armenia
|
20
|
0.01%
|
| India
|
5
|
0%
|
| Others
|
963
|
0.31%
|
| Total
|
310,814[i]
|
100%
|
Immigrant arrivals in Canada by nationality (1910 fiscal year)[81][78][82]
| Country
|
Number
|
Percentage
|
| United States
|
103,984
|
49.82%
|
| United Kingdom[d]
|
55,850
|
26.76%
|
| Austria–Hungary[h]
|
9,448
|
4.53%
|
| Russian Empire[j]
|
9,160
|
4.39%
|
| Italy
|
7,118
|
3.41%
|
| Scandinavia[f]
|
5,239
|
2.51%
|
| Ireland
|
3,940
|
1.89%
|
| Newfoundland
|
3,372
|
1.62%
|
| China
|
2,302
|
1.1%
|
| France
|
1,727
|
0.83%
|
| German Empire
|
1,538
|
0.74%
|
| Belgium
|
910
|
0.44%
|
| Netherlands
|
741
|
0.36%
|
| Ottoman Empire[g]
|
712
|
0.34%
|
| Bulgaria
|
557
|
0.27%
|
| Greece
|
452
|
0.22%
|
| Romania
|
293
|
0.14%
|
| Japan
|
271
|
0.13%
|
| Switzerland
|
211
|
0.1%
|
| Australia
|
203
|
0.1%
|
| West Indies
|
146
|
0.07%
|
| New Zealand
|
82
|
0.04%
|
| Serbia
|
76
|
0.04%
|
| Armenia
|
75
|
0.04%
|
| India
|
10
|
0%
|
| Others
|
523
|
0.25%
|
| Total
|
208,729[i]
|
100%
|
1900s
Immigrant arrivals in Canada by nationality (1909 fiscal year)[81][78][82]
| Country
|
Number
|
Percentage
|
| United States
|
59,926
|
40.77%
|
| United Kingdom[d]
|
49,292
|
33.53%
|
| Austria–Hungary[h]
|
10,681
|
7.27%
|
| Russian Empire[j]
|
5,624
|
3.83%
|
| Italy
|
4,228
|
2.88%
|
| Ireland
|
3,609
|
2.46%
|
| Scandinavia[f]
|
2,751
|
1.87%
|
| Newfoundland
|
2,108
|
1.43%
|
| China
|
2,106
|
1.43%
|
| France
|
1,830
|
1.24%
|
| German Empire
|
1,275
|
0.87%
|
| Belgium
|
828
|
0.83%
|
| Japan
|
495
|
0.34%
|
| Netherlands
|
495
|
0.34%
|
| Ottoman Empire[g]
|
425
|
0.29%
|
| Romania
|
278
|
0.19%
|
 Greece Greece
|
192
|
0.13%
|
| Australia
|
171
|
0.12%
|
| Switzerland
|
129
|
0.09%
|
| West Indies
|
113
|
0.08%
|
| Armenia
|
79
|
0.05%
|
| New Zealand
|
65
|
0.04%
|
| Bulgaria
|
56
|
0.04%
|
| Serbia
|
31
|
0.02%
|
| India
|
6
|
0%
|
| Others
|
334
|
0.23%
|
| Total
|
146,998[i]
|
100%
|
Immigrant arrivals in Canada by nationality (1908 fiscal year)[81][78][82]
| Country
|
Number
|
Percentage
|
| United Kingdom[d]
|
113,635
|
43.27%
|
| United States
|
58,445
|
22.25%
|
| Austria–Hungary[h]
|
20,400
|
7.77%
|
| Russian Empire[j]
|
15,647
|
5.96%
|
| Italy
|
11,212
|
4.27%
|
| Japan
|
7,601
|
2.89%
|
| Ireland
|
6,547
|
2.49%
|
| Scandinavia[f]
|
5,285
|
2.01%
|
| Newfoundland
|
3,374
|
1.28%
|
| France
|
2,671
|
1.02%
|
| India
|
2,623
|
1%
|
| Bulgaria
|
2,529
|
0.96%
|
| German Empire
|
2,433
|
0.93%
|
| China
|
1,884
|
0.72%
|
| Ottoman Empire[g]
|
1,221
|
0.46%
|
| Belgium
|
1,214
|
0.46%
|
| Netherlands
|
1,212
|
0.46%
|
| Greece
|
1,053
|
0.4%
|
| Romania
|
949
|
0.36%
|
| Armenia
|
563
|
0.21%
|
| Switzerland
|
195
|
0.07%
|
| Australia
|
180
|
0.07%
|
| West Indies
|
134
|
0.05%
|
| New Zealand
|
70
|
0.03%
|
| Serbia
|
48
|
0.02%
|
| Others
|
1,344
|
0.51%
|
| Total
|
262,624[i]
|
100%
|
Immigrant arrivals in Canada by nationality (June 1906-March 1907)[81][78][82]
| Country
|
Number
|
Percentage
|
| United Kingdom[d]
|
55,289
|
44.32%
|
| United States
|
34,748
|
27.85%
|
| Russian Empire[j]
|
9,261
|
7.42%
|
| Italy
|
5,114
|
4.1%
|
| Austria–Hungary[h]
|
3,463
|
2.78%
|
| Scandinavia[f]
|
3,345
|
2.68%
|
| India
|
2,124
|
1.7%
|
| Japan
|
2,042
|
1.64%
|
| German Empire
|
1,968
|
1.58%
|
| France
|
1,314
|
1.05%
|
| Newfoundland
|
1,029
|
0.82%
|
| Belgium
|
650
|
0.52%
|
| Greece
|
545
|
0.44%
|
| Ottoman Empire[g]
|
509
|
0.41%
|
| Ireland
|
502
|
0.4%
|
| Romania
|
431
|
0.35%
|
| Netherlands
|
394
|
0.32%
|
| China
|
291
|
0.23%
|
| Armenia
|
208
|
0.17%
|
| Australia
|
185
|
0.15%
|
| Bulgaria
|
179
|
0.14%
|
| Switzerland
|
112
|
0.09%
|
| West Indies
|
90
|
0.07%
|
| New Zealand
|
30
|
0.02%
|
| Serbia
|
4
|
0%
|
| Others
|
1,039
|
0.83%
|
| Total
|
124,754[k]
|
100%
|
Immigrant arrivals in Canada by nationality (1906 fiscal year)[81][78][82]
| Country
|
Number
|
Percentage
|
| United Kingdom[d]
|
85,999
|
45.49%
|
| United States
|
57,919
|
30.64%
|
| Russian Empire[j]
|
10,789
|
5.71%
|
| Austria–Hungary[h]
|
9,490
|
5.02%
|
| Italy
|
7,959
|
4.21%
|
| Scandinavia[f]
|
4,962
|
4962%
|
| Japan
|
1,922
|
1.02%
|
| German Empire
|
1,861
|
0.98%
|
| France
|
1,648
|
0.87%
|
| Belgium
|
1,106
|
0.59%
|
| Ireland
|
797
|
0.42%
|
| Ottoman Empire[g]
|
693
|
0.37%
|
| Romania
|
396
|
0.21%
|
| Netherlands
|
389
|
0.21%
|
| India
|
387
|
0.2%
|
.svg.png) Newfoundland Newfoundland
|
340
|
0.18%
|
| Australia
|
322
|
0.17%
|
| Greece
|
254
|
0.13%
|
| West Indies
|
194
|
0.1%
|
| Switzerland
|
172
|
0.09%
|
| China
|
168
|
0.09%
|
| New Zealand
|
89
|
0.05%
|
| Armenia
|
82
|
0.04%
|
| Bulgaria
|
71
|
0.04%
|
| Serbia
|
19
|
0.01%
|
| Others
|
1,186
|
0.63%
|
| Total
|
189,042[i]
|
100%
|
Immigrant arrivals in Canada by nationality (1904 fiscal year)[81][78][82]
| Country
|
Number
|
Percentage
|
| United Kingdom[d]
|
49,683
|
36.79%
|
| United States
|
45,229
|
33.49%
|
| Austria–Hungary[h]
|
10,914
|
8.08%
|
| Russian Empire[j]
|
5,682
|
4.21%
|
| Scandinavia[f]
|
5,048
|
3.74%
|
| China
|
4,847
|
3.59%
|
| Italy
|
4,445
|
3.29%
|
| German Empire
|
3,654
|
2.71%
|
| France
|
1,534
|
1.14%
|
| Belgium
|
858
|
0.64%
|
| Ireland
|
691
|
0.51%
|
| Romania
|
619
|
0.46%
|
| Newfoundland
|
519
|
0.38%
|
| Ottoman Empire[g]
|
398
|
0.29%
|
| Greece
|
191
|
0.14%
|
| Netherlands
|
169
|
0.13%
|
| Switzerland
|
128
|
0.09%
|
| Armenia
|
81
|
0.06%
|
| Australia
|
58
|
0.04%
|
| West Indies
|
55
|
0.04%
|
| New Zealand
|
23
|
0.02%
|
| Bulgaria
|
14
|
0.01%
|
| Serbia
|
10
|
0.01%
|
| Others
|
328
|
0.24%
|
| Total
|
135,050[i]
|
100%
|
Immigrant arrivals in Canada by nationality (1902 fiscal year)[81][78][82][83]
| Country
|
Number
|
Percentage
|
| United States
|
26,388
|
37.19%
|
| United Kingdom[d]
|
16,947
|
23.89%
|
| Austria-Hungary[h]
|
7,918
|
11.16%
|
| Italy
|
3,828
|
5.4%
|
| Scandinavia[f]
|
3,743
|
5.28%
|
| China
|
3,587
|
5.06%
|
| Russian Empire[j]
|
2,467
|
3.48%
|
| Ottoman Empire[g]
|
1,083
|
1.53%
|
| German Empire
|
1,048
|
1.48%
|
| Romania
|
551
|
0.78%
|
| France
|
431
|
0.61%
|
| Ireland
|
312
|
0.44%
|
| Belgium
|
223
|
0.31%
|
| Greece
|
161
|
0.23%
|
| Armenia
|
112
|
0.16%
|
| Netherlands
|
35
|
0.05%
|
| Switzerland
|
17
|
0.02%
|
| Australia
|
11
|
0.02%
|
| Bulgaria
|
1
|
0%
|
| Others
|
2,032
|
2.86%
|
| Total
|
70,951[i]
|
100%
|
1890s
1860s
Immigrant arrivals in Canada by country of birth (1865)[84][85]
| Country
|
Number
|
Percentage
|
| England
|
9,296
|
43.53%
|
| Europe
|
4,770
|
22.34%
|
| Ireland
|
4,682
|
21.92%
|
| Scotland
|
2,601
|
12.18%
|
| Others
|
6
|
0.03%
|
| Total
|
21,355
|
100%
|
Immigrant arrivals in Canada by country of birth (1864)[84][85]
| Country
|
Number
|
Percentage
|
| Europe
|
7,453
|
38.93%
|
| England
|
5,013
|
26.18%
|
| Ireland
|
3,767
|
19.67%
|
| Scotland
|
2,914
|
15.22%
|
| Others
|
—
|
—
|
| Total
|
19,147
|
100%
|
Immigrant arrivals in Canada by country of birth (1863)[84][85]
| Country
|
Number
|
Percentage
|
| England
|
6,317
|
32.53%
|
| Ireland
|
4,949
|
25.49%
|
| Europe
|
4,182
|
21.54%
|
| Scotland
|
3,959
|
20.39%
|
| Others
|
12
|
0.06%
|
| Total
|
19,419
|
100%
|
Immigrant arrivals in Canada by country of birth (1862)[84][85]
| Country
|
Number
|
Percentage
|
| Europe
|
7,728
|
34.85%
|
| England
|
6,877
|
31.01%
|
| Ireland
|
4,545
|
20.5%
|
| Scotland
|
2,979
|
13.43%
|
| Others
|
47
|
0.21%
|
| Total
|
22,176
|
100%
|
Immigrant arrivals in Canada by country of birth (1861)[84][85]
| Country
|
Number
|
Percentage
|
| Europe
|
10,618
|
53.3%
|
| England
|
7,780
|
39.05%
|
| Scotland
|
1,112
|
5.58%
|
| Ireland
|
413
|
2.07%
|
| Others
|
—
|
—
|
| Total
|
19,923
|
100%
|
Immigrant arrivals in Canada by country of birth (1860)[84][85]
| Country
|
Number
|
Percentage
|
| England
|
6,481
|
63.85%
|
| Europe
|
2,314
|
22.8%
|
| Scotland
|
979
|
9.65%
|
| Ireland
|
376
|
3.7%
|
| Others
|
—
|
—
|
| Total
|
10,150
|
100%
|
1850s
Immigrant arrivals in Canada by country of birth (1859)[84][85]
| Country
|
Number
|
Percentage
|
| England
|
4,846
|
55.21%
|
| Europe
|
2,722
|
31.01%
|
| Scotland
|
793
|
9.03%
|
| Ireland
|
417
|
4.75%
|
| Others
|
—
|
—
|
| Total
|
8,778
|
100%
|
Immigrant arrivals in Canada by country of birth (1858)[84][85]
| Country
|
Number
|
Percentage
|
| England
|
6,441
|
50.28%
|
| Europe
|
3,578
|
27.93%
|
| Scotland
|
1,424
|
11.12%
|
| Ireland
|
1,153
|
9%
|
| Others
|
214
|
1.67%
|
| Total
|
12,810
|
100%
|
Immigrant arrivals in Canada by country of birth (1857)[84][85]
| Country
|
Number
|
Percentage
|
| England
|
15,471
|
48.2%
|
| Europe
|
11,368
|
35.42%
|
| Scotland
|
3,218
|
10.03%
|
| Ireland
|
2,016
|
6.28%
|
| Others
|
24
|
0.07%
|
| Total
|
32,097
|
100%
|
Immigrant arrivals in Canada by country of birth (1856)[84][85]
| Country
|
Number
|
Percentage
|
| England
|
10,353
|
46.14%
|
| Europe
|
7,343
|
32.72%
|
| Scotland
|
2,794
|
12.45%
|
| Ireland
|
1,688
|
7.52%
|
| Others
|
261
|
1.16%
|
| Total
|
22,439
|
100%
|
Immigrant arrivals in Canada by country of birth (1855)[84][85]
| Country
|
Number
|
Percentage
|
| England
|
6,754
|
31.75%
|
| Scotland
|
4,859
|
22.84%
|
| Europe
|
4,864
|
22.86%
|
| Ireland
|
4,106
|
19.3%
|
| Others
|
691
|
3.25%
|
| Total
|
21,274
|
100%
|
Immigrant arrivals in Canada by country of birth (1854)[84][85]
| Country
|
Number
|
Percentage
|
| England
|
18,175
|
34.18%
|
| Ireland
|
16,165
|
30.4%
|
| Europe
|
11,537
|
21.69%
|
| Scotland
|
6,446
|
12.12%
|
| Others
|
857
|
1.61%
|
| Total
|
53,180
|
100%
|
Immigrant arrivals in Canada by country of birth (1853)[84][85]
| Country
|
Number
|
Percentage
|
| Ireland
|
14,417
|
39.28%
|
| England
|
9,585
|
26.12%
|
| Europe
|
7,456
|
20.32%
|
| Scotland
|
4,745
|
12.93%
|
| Others
|
496
|
1.35%
|
| Total
|
36,699
|
100%
|
Immigrant arrivals in Canada by country of birth (1852)[84][85]
| Country
|
Number
|
Percentage
|
| Ireland
|
15,983
|
40.8%
|
| England
|
9,276
|
23.68%
|
| Europe
|
7,256
|
18.52%
|
| Scotland
|
5,477
|
13.98%
|
| Others
|
1,184
|
3.02%
|
| Total
|
39,176
|
100%
|
See also
Notes
- ^ a b British North American territory (Upper Canada, Lower Canada, New Brunswick, and Nova Scotia) that comprised the Dominion of Canada following Canadian Confederation in 1867.
- ^ a b Province of Canada territory (Upper Canada & Lower Canada) and New Brunswick.
- ^ a b Officially, the People's Republic of China. Excludes Hong Kong, Macau, and Taiwan (listed separately).
- ^ a b c d e f g h i j k l m n o p q r s t u v w x y z aa ab ac ad ae Officially, the United Kingdom of Great Britain and Northern Ireland. Includes England, Scotland, Wales, Northern Ireland, Crown Colonies, and British Overseas Territories.
- ^ a b c d e f 'n.e.s.' – not elsewhere specified.
- ^ a b c d e f g h i j k l m n o p q r s t u v Including Denmark, Finland, Iceland, Norway, and Sweden.
- ^ a b c d e f g h i j k l m n o p q r s t u Including Syria–Lebanon and Turkey.
- ^ a b c d e f g h i j k l m n o p q r s t u Including Austria, Hungary, Bukovina, and Galicia.
- ^ a b c d e f g h i j k l m n o p q r s t u Total figures indicated detail fiscal year and not calendar year.
- ^ a b c d e f g h i j k l m n o p q r Including Russia, Poland, and Ruthenia.
- ^ Incomplete figures as data for fiscal year cut short; nine months ended March 31.
- ^ Incomplete figures; data for six months from January to June, inclusive.
References
- ^ a b c d e f Government of Canada, Statistics Canada (2013). "Censuses of Canada 1665 to 1871: Estimated population of Canada, 1605 to present". Retrieved 30 October 2022.
- ^ a b c d e f Government of Canada, Statistics Canada (17 May 2018). "150 years of immigration in Canada". www12.statcan.gc.ca. Retrieved 30 October 2022.
- ^ a b c d e f Government of Canada, Statistics Canada (12 April 2017). "Permanent Residents – Monthly IRCC Updates". Retrieved 19 November 2022.
- ^ a b c d e f Government of Canada, Statistics Canada (12 April 2017). "Permanent Residents – Monthly IRCC Updates – Canada – Admissions of Permanent Residents by Country of Citizenship". Retrieved 6 January 2023.
- ^ Government of Canada, Statistics Canada (3 January 2023). "Canada welcomes historic number of newcomers in 2022". www12.statcan.gc.ca. Retrieved 6 January 2023.
- ^ a b c Government of Canada, Statistics Canada (28 September 2022). "Population estimates on July 1st, by age and sex". www12.statcan.gc.ca. Retrieved 30 October 2022.
- ^ a b c d e f g Government of Canada, Statistics Canada (5 November 2015). "Archived - Historical statistics, immigration to Canada, by country of last permanent residence". Retrieved 4 July 2025.
- ^ a b c d e f g Government of Canada, Statistics Canada (27 June 2018). "Historical statistics, immigration to Canada, by country of last permanent residence". Retrieved 19 November 2022.
- ^ a b c d e f g h Government of Canada, Statistics Canada (26 September 2013). "Archived - Immigrants to Canada, by country of last permanent residence". Retrieved 4 July 2025.
- ^ a b c d e f g h Government of Canada, Statistics Canada (27 June 2018). "Immigrants to Canada, by country of last permanent residence". Retrieved 19 November 2022.
- ^ a b c Government of Canada, Statistics Canada (25 September 2016). "Permanent Residents – Ad Hoc IRCC (Specialized Datasets)". Retrieved 19 November 2022.
- ^ a b Government of Canada, Statistics Canada (1 December 2016). "Permanent Residents – Ad Hoc IRCC (Specialized Datasets) - Canada - Admissions of Permanent Residents by Country of Citizenship (Q1-Q2 2016 ranking), 1980 - Q2 2016". Retrieved 15 August 2025.
- ^ a b c Government of Canada, Statistics Canada (26 October 2022). "Immigrants make up the largest share of the population in over 150 years and continue to shape who we are as Canadians". www12.statcan.gc.ca. Retrieved 6 November 2022.
- ^ Government of Canada, Statistics Canada (26 October 2022). "Visible minority and population group by generation status: Canada, provinces and territories, census metropolitan areas and census agglomerations with parts". www12.statcan.gc.ca. Retrieved 6 November 2022.
- ^ Government of Canada, Statistics Canada (8 September 2022). "Canada in 2041: A larger, more diverse population with greater differences between regions". www12.statcan.gc.ca. Retrieved 5 November 2022.
- ^ Government of Canada, Statistics Canada (8 September 2022). "Projected population by racialized group, generation status and other selected characteristics (x 1,000)". www12.statcan.gc.ca. Retrieved 5 November 2022.
- ^ "Parties prepare to battle for Immigrant votes". CTV News. Bell Media. 14 March 2010. Archived from the original on 16 March 2010. Retrieved 15 March 2010.
- ^ a b Government of Canada, Statistics Canada (26 October 2022). "Immigrant status and period of immigration by place of birth and citizenship: Canada, provinces and territories and census metropolitan areas with parts". www12.statcan.gc.ca. Retrieved 26 November 2022.
- ^ a b Government of Canada, Statistics Canada (26 October 2022). "Focus on Geography Series, 2021 Census of Population Canada Immigration, place of birth, and citizenship". www12.statcan.gc.ca. Retrieved 26 November 2022.
- ^ a b Statistics Canada (25 October 2017). "Immigrant population by place of birth, period of immigration, 2016 counts, both sexes, age (total), Canada, 2016 Census – 25% Sample data | Immigration and Ethnocultural Diversity Highlight Tables". Statistics Canada. Government of Canada. Retrieved 27 May 2018.
- ^ a b Government of Canada, Statistics Canada (23 January 2019). "2011 National Household Survey: Data tables Profile - Immigration and Ethnocultural Diversity, and Aboriginal Peoples for Canada, Provinces, Territories, Census Divisions and Census Subdivisions, National Household Survey, 2011". www12.statcan.gc.ca. Retrieved 4 March 2023.
- ^ a b Government of Canada, Statistics Canada (27 November 2015). "NHS Profile, Canada, 2011". www12.statcan.gc.ca. Retrieved 4 March 2023.
- ^ a b Government of Canada, Statistics Canada (25 July 2018). "Immigration and Ethnocultural Diversity in Canada". www12.statcan.gc.ca. Retrieved 16 November 2022.
- ^ a b Government of Canada, Statistics Canada (23 March 2009). "Place of birth for the immigrant population by period of immigration, 2006 counts and percentage distribution, for Canada, provinces and territories - 20% sample data". www12.statcan.gc.ca. Retrieved 16 November 2022.
- ^ a b Government of Canada, Statistics Canada (1 May 2020). "2006 Census Topic-based tabulations Immigrant Status and Period of Immigration (8) and Place of Birth (261) for the Immigrants and Non-permanent Residents of Canada, Provinces, Territories, Census Metropolitan Areas and Census Agglomerations, 2006 Census - 20% Sample Data". www12.statcan.gc.ca. Retrieved 16 November 2022.
- ^ a b Government of Canada, Statistics Canada (20 November 2009). "2006 Census: Immigration in Canada: A Portrait of the Foreign-born Population, 2006 Census: Findings". www12.statcan.gc.ca. Retrieved 16 November 2022.
- ^ a b Government of Canada, Statistics Canada (23 December 2013). "2001 Census Topic-based tabulations Immigrant Status and Period of Immigration (10A) and Place of Birth of Respondent (260) for Immigrants and Non-permanent Residents, for Canada, Provinces, Territories, Census Metropolitan Areas and Census Agglomerations, 2001 Census - 20% Sample Data". www12.statcan.gc.ca. Retrieved 16 November 2022.
- ^ a b Government of Canada, Statistics Canada (21 January 2003). "Canada's Ethnocultural Portrait: The Changing Mosaic, 2001 Census - ARCHIVED". www12.statcan.gc.ca. Retrieved 16 November 2022.
- ^ a b c d Government of Canada, Statistics Canada (23 December 2013). "2001 Census Topic-based tabulations Selected Places of Birth (85) for the Immigrant Population, for Canada, Provinces, Territories, Census Metropolitan Areas and Census Agglomerations, 1996 and 2001 Censuses - 20% Sample Data". www12.statcan.gc.ca. Retrieved 16 November 2022.
- ^ a b c d e f g h Government of Canada, Statistics Canada (23 December 2013). "2001 Census Topic-based tabulations Immigrant Status (4) for Population, for Canada, Provinces and Territories, 1911 to 2001 Censuses - 20% Sample Data". www12.statcan.gc.ca. Retrieved 16 November 2022.
- ^ a b Government of Canada, Statistics Canada (4 June 2019). "Data tables, 1996 Census Immigrant Population by Place of Birth (260A) and Sex (3), Showing Period of Immigration (6), for Canada, Provinces, Territories and Census Metropolitan Areas, 1996 Census (20% Sample Data)". www12.statcan.gc.ca. Retrieved 11 July 2025.
- ^ a b Government of Canada, Statistics Canada (4 June 2019). "Data tables, 1996 Census Immigrant Population by Selected Places of Birth (16), Age at Immigration (12) and Sex (3), Showing Period of Immigration (6), for Canada, Provinces, Territories and Census Metropolitan Areas, 1996 Census (20% Sample Data)". www12.statcan.gc.ca. Retrieved 11 July 2025.
- ^ a b Government of Canada, Statistics Canada (4 June 2019). "Data tables, 1996 Census Immigrant Population by Selected Places of Birth (16), Age Group (7B), and Sex (3), Showing Period of Immigration (6), for Canada, Provinces, Territories and Census Metropolitan Areas, 1996 Census (20% Sample Data)". www12.statcan.gc.ca. Retrieved 11 July 2025.
- ^ a b c d Government of Canada, Statistics Canada (23 December 2013). "Data tables, 1996 Census Immigrant Population by Selected Places of Birth (84) and Sex (3), for Canada, Provinces, Territories and Census Metropolitan Areas, 1986-1996 Censuses (20% Sample Data)". www12.statcan.gc.ca. Retrieved 11 July 2025.
- ^ a b Government of Canada, Statistics Canada (3 April 2013). "1981 Census of Canada : volume 1 - national series : population Place of birth, citizenship, period of immigration". www12.statcan.gc.ca. Retrieved 8 July 2025.
- ^ a b Government of Canada, Statistics Canada (3 April 2013). "1981 census information on place of birth, citizenship and immigration : some facts and figures / by Walton O. Boxhill, Robert McCrea, Michael Crew". www12.statcan.gc.ca. Retrieved 8 July 2025.
- ^ a b Government of Canada, Statistics Canada (26 May 2020). "Data tables, 1981 Census Census Profile for Canada, Provinces and Territories, Census Divisions and Census Subdivisions, 1981 Census - Part A". www12.statcan.gc.ca. Retrieved 8 July 2025.
- ^ a b Government of Canada, Statistics Canada (26 May 2020). "Data tables, 1981 Census Census Profile for Canada, Provinces and Territories, Census Divisions and Census Subdivisions, 1981 Census - Part B". www12.statcan.gc.ca. Retrieved 8 July 2025.
- ^ a b c d e f g h i j k l m n o p q r s t u v w Government of Canada, Statistics Canada (4 September 2022). "Historical statistics of Canada, section A: Population and migration – ARCHIVED". www12.statcan.gc.ca. Retrieved 4 September 2022.
- ^ a b c d e f g h i j k Government of Canada, Statistics Canada (4 September 2022). "1971 Census of Canada : population : vol. I – part 3 = Recensement du Canada 1971 : population : vol. I – partie 3. Birthplace. TABLE 33. Population by Birthplace, for Canada, 1921–1971". www12.statcan.gc.ca. Retrieved 30 October 2022.
- ^ a b Government of Canada, Statistics Canada (3 April 2013). "1971 Census of Canada : population : vol. I - part 3 Birthplace". www12.statcan.gc.ca. Retrieved 9 July 2025.
- ^ a b Government of Canada, Statistics Canada (3 April 2013). "1961 Census of Canada : population : vol. I - part 2 Place of birth". www12.statcan.gc.ca. Retrieved 9 July 2025.
- ^ a b Government of Canada, Statistics Canada (3 April 2013). "Ninth census of Canada, 1951 Vol. 1. Population: general characteristics". www12.statcan.gc.ca. Retrieved 9 July 2025.
- ^ a b Government of Canada, Statistics Canada (3 April 2013). "Eighth census of Canada,1941 Vol. 1. General review and summary tables". www12.statcan.gc.ca. Retrieved 9 July 2025.
- ^ a b Government of Canada, Statistics Canada (3 April 2013). "Eighth census of Canada,1941 Vol. 3. Ages of the population classifed by sex, conjugal condition, racial origin, religious denomination, birthplace, etc." www12.statcan.gc.ca. Retrieved 9 July 2025.
- ^ a b Government of Canada, Statistics Canada (3 April 2013). "Eighth census of Canada,1941 Vol. 4. Cross-classifications, interprovincial migration, blind and deaf-mutes". www12.statcan.gc.ca. Retrieved 9 July 2025.
- ^ a b c d Government of Canada, Statistics Canada (3 April 2013). "Seventh census of Canada, 1931 . v. 1. Summary". www12.statcan.gc.ca. Retrieved 9 July 2025.
- ^ a b Government of Canada, Statistics Canada (3 April 2013). "Seventh census of Canada, 1931 . v. 2. Population by areas". www12.statcan.gc.ca. Retrieved 9 July 2025.
- ^ a b Government of Canada, Statistics Canada (3 April 2013). "Seventh census of Canada, 1931 . v. 3. Ages of the people, classified by sex, conjugal condition, racial origin, religion, birthplace, language, literacy, school attendance, year of immigration, naturalization, etc". www12.statcan.gc.ca. Retrieved 9 July 2025.
- ^ a b Government of Canada, Statistics Canada (3 April 2013). "Seventh census of Canada, 1931 . v. 4. Cross-classification". www12.statcan.gc.ca. Retrieved 19 August 2023.
- ^ a b Government of Canada, Statistics Canada (3 April 2013). "Sixth census of Canada, 1921 . Vol. II: Ages, conjugal condition, birthplace, birthplace of parents, year of immigration and naturalization, language spoken, literacy, school attendance, blindness and deaf-mutism". www12.statcan.gc.ca. Retrieved 14 October 2023.
- ^ Government of Canada, Statistics Canada (3 April 2013). "Fifth census of Canada 1911 . v. 2. Religions, origins, birthplace, citizenship, literacy and infirmities, by provinces, districts and sub-districts". www12.statcan.gc.ca. Retrieved 8 August 2025.
- ^ Government of Canada, Statistics Canada (3 April 2013). "Fourth census of Canada 1901 . v. 1. Population". www12.statcan.gc.ca. Retrieved 9 August 2025.
- ^ Government of Canada, Statistics Canada (3 April 2013). "Census of Canada 1890-91 v. 2". www12.statcan.gc.ca. Retrieved 11 August 2025.
- ^ Government of Canada, Statistics Canada (3 April 2013). "Census of Canada 1890-91 v. 1". www12.statcan.gc.ca. Retrieved 11 August 2025.
- ^ a b Government of Canada, Statistics Canada (23 July 2012). "Censuses of Canada, 1665 to 1871 = Recensements du Canada, 1665 to 1871". www12.statcan.gc.ca. Retrieved 3 August 2025.
- ^ Government of Canada, Statistics Canada (4 November 2010). "Census of population, British North America by native origins, 1861". www12.statcan.gc.ca. Retrieved 2 August 2025.
- ^ Government of Canada, Statistics Canada (11 October 2017). "Canada Year Book 1867". www12.statcan.gc.ca. pp. 16–21. Retrieved 3 August 2025.
- ^ "Canada-Ukraine authorization for emergency travel: Key figures". Government of Canada. 26 July 2024. Retrieved 13 August 2025.
- ^ "Ukraine immigration measures: Key figures". Government of Canada. 30 March 2022. Archived from the original on 2 January 2023. Retrieved 6 January 2023.
- ^ "Ukraine immigration measures: Key figures". Government of Canada. 30 March 2022. Archived from the original on 14 May 2023. Retrieved 10 June 2023.
- ^ Government of Canada, Statistics Canada (31 July 2015). "Facts & Figures 2015: Immigration Overview - Permanent Residents – Annual IRCC Updates". Retrieved 15 August 2025.
- ^ Government of Canada, Statistics Canada (1 December 2016). "Facts & Figures 2015: Immigration Overview - Permanent Residents – Annual IRCC Updates - Canada – Permanent residents by gender and category". Retrieved 15 August 2025.
- ^ Immigration, Refugees and Citizenship Canada. "Table 2: Permanent Residents Admitted in 2019 by Top 10 Source Countries", 2020 Annual Report to Parliament on Immigration. Canada.ca. ISSN 1706-3329.
- ^ Anderson, Stuart (2020). "Immigrants Flock To Canada, While U.S. Declines". Forbes. Retrieved 16 April 2020.
- ^ IRCC (2018). "2018 Annual Report to Parliament on Immigration". Immigration, Refugee and Citizenship Canada. Government of Canada. Retrieved 22 December 2018.
- ^ IRCC (2017). "2017 Annual Report to Parliament on Immigration". Immigration, Refugees and Citizenship Canada. Government of Canada. Table 3: Permanent Residents Admitted in 2016, by Top 10 Source Countries. Retrieved 21 July 2018.
- ^ IRCC (2016). "Annual Report to Parliament on Immigration, 2016". Immigration, Refugees and Citizenship Canada. Government of Canada. Retrieved 5 May 2020.
- ^ CIC. "Facts and figures 2011 – Immigration overview: Permanent and temporary residents". Citizenship and Immigration Canada. Government of Canada. Archived from the original on 30 December 2012. Retrieved 10 January 2013.
- ^ a b Canada, Statistics (11 October 2017). "Canada Year Book 1952". www66.statcan.gc.ca. pp. 163–174. Retrieved 12 August 2025.
- ^ a b Canada, Statistics (11 October 2017). "Canada Year Book 1955". www66.statcan.gc.ca. pp. 164–176. Retrieved 12 August 2025.
- ^ a b Canada, Statistics (11 October 2017). "Canada Year Book 1957". www66.statcan.gc.ca. pp. 154–187. Retrieved 12 August 2025.
- ^ a b Canada, Statistics (11 October 2017). "Canada Year Book 1960". www66.statcan.gc.ca. pp. 216–227. Retrieved 12 August 2025.
- ^ a b Canada, Statistics (11 October 2017). "Canada Year Book 1942". www66.statcan.gc.ca. pp. 151–170. Retrieved 13 August 2025.
- ^ a b Canada, Statistics (11 October 2017). "Canada Year Book 1943". www66.statcan.gc.ca. pp. 176–186. Retrieved 13 August 2025.
- ^ a b Canada, Statistics (11 October 2017). "Canada Year Book 1948". www66.statcan.gc.ca. pp. 172–184. Retrieved 13 August 2025.
- ^ a b Canada, Statistics (11 October 2017). "Canada Year Book 1960". www66.statcan.gc.ca. pp. 138–152. Retrieved 13 August 2025.
- ^ a b c d e f g h i j k l m n o p q r s t u v w Government of Canada, Statistics Canada (10 August 2009). "Record of oriental immigrants, fiscal years ended 1901 to 1936". www12.statcan.gc.ca. Retrieved 7 October 2023.
- ^ a b c d e f g h Canada, Statistics (11 October 2017). "Canada Year Book 1921". www66.statcan.gc.ca. pp. 122–131. Retrieved 2 August 2025.
- ^ a b c d e f g Canada, Statistics (31 March 2008). "Canada Year Book 1920". www66.statcan.gc.ca. Retrieved 1 August 2025.
- ^ a b c d e f g h i j k l m n o p q r Government of Canada, Statistics Canada (12 February 2009). "Number of immigrant arrivals in Canada, by fiscal year and place of origin, 1897 to 1917". www12.statcan.gc.ca. Retrieved 7 October 2023.
- ^ a b c d e f g h i j k l m n Government of Canada, Statistics Canada (11 October 2017). "Canada Year Book 1913". www12.statcan.gc.ca. pp. 102–112. Retrieved 26 December 2023.
- ^ a b c d e Canada, Statistics (31 March 2008). "Canada Year Book 1903". www66.statcan.gc.ca. Retrieved 26 July 2025.
- ^ a b c d e f g h i j k l m n Government of Canada, Statistics Canada (4 November 2010). "Immigration, arrivals from 1852 to 1865". www12.statcan.gc.ca. Retrieved 26 December 2023.
- ^ a b c d e f g h i j k l m n Government of Canada, Statistics Canada (11 October 2017). "Canada Year Book 1872". www12.statcan.gc.ca. pp. 162–176. Retrieved 2 August 2025.