2025 Australian federal election
(House of Representatives)|
|
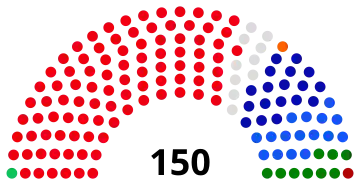
All 150 seats in the Australian House of Representatives
76 seats needed for a majority |
| Turnout | 90.70% |
|---|
|
This lists parties that won seats. See the complete results below. 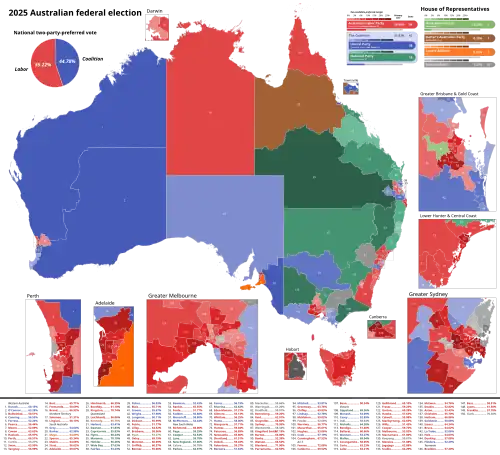 Results by winning party by division for the House of Representatives.
  Results by Two-Party Preferred (TPP) vote by division by the House of Representatives.
 |
|
The number of seats won by each party in the Australian House of Representatives at the 2025 federal election were: Labor 94, Coalition 43, Greens 1, Centre Alliance 1, Katter's Australian Party 1, and Independents 10.
This election was held using instant-runoff voting.
Australia
 Government (94)
Labor (94)
Opposition (43)
Liberal–National Coalition:
Liberal (18)
Liberal National (Qld) (16)[b]
National (9)
Crossbench (13)
Independent (10)
Greens (1)
Centre Alliance (1)
Katter's Australian (1)
House of Representatives (IRV) – Turnout 90.70% (CV)
|
| Party
|
Primary Vote
|
Seats
|
| Votes
|
%
|
Swing (pp)
|
Seats
|
Change
|
|
|
Labor
|
5,354,138
|
34.56
|
+1.98
|
94
|
 17 17
|
|
|
Liberal–National Coalition
|
4,929,402
|
31.82
|
−3.88
|
43
|
 15 15
|
|
|
Liberal
|
3,205,216
|
20.69
|
−3.20
|
18
|
9
|
|
|
Liberal National (Qld)
|
1,099,623
|
7.10
|
−0.90
|
16
|
5
|
|
|
Nationals
|
588,778
|
3.80
|
+0.20
|
9
|
1
|
|
|
Country Liberal (NT)
|
35,785
|
0.23
|
+0.03
|
0
|

|
|
|
Greens
|
1,889,977
|
12.20
|
−0.05
|
1
|
3
|
|
|
One Nation
|
991,814
|
6.40
|
+1.44
|
0
|
|
|
|
Trumpet of Patriots
|
296,076
|
1.91
|
+1.52[c]
|
0
|
|
|
|
Family First
|
273,681
|
1.77
|
+1.77[d]
|
0
|
|
|
|
Legalise Cannabis
|
186,335
|
1.20
|
+1.16
|
0
|
|
|
|
Libertarian
|
83,474
|
0.54
|
−1.19[e]
|
0
|
|
|
|
People First
|
71,892
|
0.46
|
+0.46[d]
|
0
|
|
|
|
Katter's Australian
|
51,775
|
0.33
|
−0.05
|
1
|
|
|
|
Centre Alliance
|
37,453
|
0.24
|
−0.01
|
1
|
|
|
|
Animal Justice
|
35,312
|
0.23
|
−0.37
|
0
|
|
|
|
Christians
|
31,365
|
0.20
|
+0.06
|
0
|
|
|
|
Shooters, Fishers, Farmers
|
26,968
|
0.17
|
+0.04
|
0
|
|
|
|
Victorian Socialists
|
23,652
|
0.15
|
−0.04
|
0
|
|
|
|
Citizens
|
20,770
|
0.13
|
+0.10
|
0
|
|
|
|
Socialist Alliance
|
18,653
|
0.12
|
+0.04
|
0
|
|
|
|
FUSION
|
14,374
|
0.09
|
+0.00
|
0
|
|
|
|
Indigenous-Aboriginal
|
6,306
|
0.04
|
−0.01
|
0
|
|
|
|
HEART
|
5,138
|
0.03
|
−0.15
|
0
|
|
|
|
Great Australian
|
1,509
|
0.01
|
−0.20
|
0
|
|
|
|
Democrats
|
688
|
0.00
|
+0.00
|
0
|
|
|
|
Independents
|
1,126,051
|
7.27
|
+1.98
|
10
|
|
|
|
Not affiliated
|
13,433
|
0.09
|
+0.08
|
0
|
|
| Total
|
15,490,236
|
|
|
150
|
1
|
| Two-party-preferred vote
|
|
|
Labor
|
8,553,231
|
55.22
|
+3.09
|
|
|
|
Liberal–National Coalition
|
6,937,005
|
44.78
|
−3.09
|
|
|
| Informal votes
|
919,512
|
5.60
|
+0.41
|
|
| Turnout
|
16,409,748
|
90.70
|
+2.45
|
| Registered voters
|
18,098,797
|
–
|
–
|
| Source: AEC,[1] ABC[2]
|
| Primary vote |
|---|
|
|
|
| Labor |
|
34.56% |
| Coalition |
|
31.82% |
| Greens |
|
12.20% |
| Independents |
|
7.27% |
| One Nation |
|
6.40% |
| Trumpet of Patriots |
|
1.91% |
| Others |
|
5.84% |
|
| Two-party preferred vote |
|---|
|
|
|
| Labor |
|
55.22% |
| Coalition |
|
44.78% |
|
| Seats |
|---|
|
|
|
| Labor |
|
62.67% |
| Coalition |
|
28.67% |
| Independents |
|
6.67% |
| Greens |
|
0.67% |
| Katter's Australian |
|
0.67% |
| Centre Alliance |
|
0.67% |
|
States
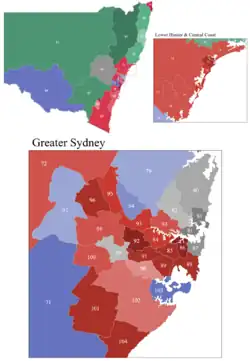
New South Wales
2025 Australian federal election
(New South Wales)|
|
|
|
|
 |
House of Representatives (IRV) – Turnout 91.58% (CV)
| Party
|
Primary Vote
|
Seats
|
| No.
|
%
|
Swing (pp)
|
No.
|
Change
|
|
|
Labor
|
1,686,994
|
35.20
|
+1.82
|
28
|
2
|
|
|
Liberal–National Coalition
|
1,511,236
|
31.53
|
−5.01
|
12
|
4
|
|
|
Liberal
|
1,160,759
|
24.22
|
−4.08
|
6
|
3
|
|
|
Nationals
|
350,477
|
7.31
|
−0.93
|
6
|
1
|
|
|
Greens
|
530,302
|
11.06
|
+1.04
|
0
|
|
|
|
One Nation
|
288,676
|
6.02
|
+1.18
|
0
|
|
|
|
Trumpet of Patriots
|
87,846
|
1.83
|
+1.77
|
0
|
|
|
|
Family First
|
63,818
|
1.33
|
+1.33
|
0
|
|
|
|
Libertarian
|
52,124
|
1.09
|
−1.00
|
0
|
|
|
|
Legalise Cannabis
|
44,764
|
0.93
|
+0.93
|
0
|
|
|
|
Shooters, Fishers, Farmers
|
23,511
|
0.49
|
+0.17
|
0
|
|
|
|
Animal Justice
|
10,062
|
0.21
|
−0.16
|
0
|
|
|
|
Citizens
|
6,253
|
0.13
|
+0.08
|
0
|
|
|
|
People First
|
5,442
|
0.11
|
+0.11
|
0
|
|
|
|
Fusion
|
4,394
|
0.09
|
−0.09
|
0
|
|
|
|
Socialist Alliance
|
4,032
|
0.08
|
+0.05
|
0
|
|
|
|
HEART
|
3,916
|
0.08
|
−0.22
|
0
|
|
|
|
Indigenous-Aboriginal
|
3,117
|
0.07
|
−0.09
|
0
|
|
|
|
Democrats
|
688
|
0.01
|
+0.00
|
0
|
|
|
|
Independent
|
465,188
|
9.71
|
+2.15
|
6
|
1
|
|
|
Not affiliated
|
888
|
0.02
|
−0.00
|
0
|
|
| Total |
4,793,251 |
100.00 |
– |
46 |
1
|
|
|
| Informal |
420,008 |
8.06 |
+1.84 |
– |
–
|
| Turnout |
5,213,259 |
91.58 |
+2.80 |
– |
–
|
| Registered voters |
5,694,989 |
– |
– |
– |
–
|
| Two-party-preferred vote
|
|
|
Labor
|
2,649,390
|
55.27
|
+3.85
|
|
|
|
|
Liberal–National Coalition
|
2,143,861
|
44.73
|
−3.85
|
|
|
| Source: AEC[3]
|
Liberal to Labor: Banks, Bennelong,[f] Hughes
Liberal to Independent: Bradfield
|
|---|
|
- Divisions in: New South Wales
- Victoria
- Queensland
- Western Australia
- South Australia
- Tasmania
- Australian Capital and Northern Territories
|
Victoria
2025 Australian federal election
(Victoria)|
|
|
|
|
 |
House of Representatives (IRV) – Turnout 92.44% (CV)
| Party
|
Votes
|
%
|
Swing (pp)
|
Seats
|
Change (seats)
|
|
|
Labor
|
1,375,995
|
33.95
|
+1.10
|
27
|
3
|
|
|
Liberal–National Coalition
|
1,304,936
|
32.20
|
−0.88
|
9
|
2
|
|
|
Liberal
|
1,117,878
|
27.58
|
−1.93
|
6
|
2
|
|
|
Nationals
|
187,058
|
4.62
|
+1.05
|
3
|
|
|
|
Greens
|
550,659
|
13.59
|
−0.15
|
0
|
1
|
|
|
One Nation
|
234,482
|
5.79
|
+1.96
|
0
|
|
|
|
Family First
|
89,584
|
2.21
|
+2.21
|
0
|
|
|
|
Legalise Cannabis
|
56,114
|
1.38
|
+1.38
|
0
|
|
|
|
Trumpet of Patriots
|
50,471
|
1.25
|
+0.70
|
0
|
|
|
|
Libertarian
|
24,744
|
0.61
|
−1.92
|
0
|
|
|
|
Victorian Socialists
|
23,652
|
0.58
|
−0.15
|
0
|
|
|
|
Socialist Alliance
|
12,017
|
0.30
|
+0.15
|
0
|
|
|
|
Citizens
|
7,343
|
0.18
|
+0.13
|
0
|
|
|
|
Animal Justice
|
6,548
|
0.16
|
−0.59
|
0
|
|
|
|
People First
|
5,979
|
0.15
|
+0.15
|
0
|
|
|
|
Fusion
|
4,869
|
0.12
|
+0.06
|
0
|
|
|
|
Independent
|
305,184
|
7.53
|
+1.02
|
2
|
1
|
|
|
Not affiliated
|
487
|
0.01
|
+0.01
|
0
|
|
| Total |
4,053,064 |
100.00 |
– |
38 |
1
|
|
|
| Invalid/blank votes |
179,441 |
4.24 |
−0.47 |
– |
–
|
| Turnout |
4,232,505 |
92.44 |
+4.43 |
– |
–
|
| Registered voters |
4,580,348 |
– |
– |
– |
–
|
| Two-party-preferred vote
|
|
|
Labor
|
2,283,824
|
56.35
|
+1.52
|
|
|
|
|
Liberal–National Coalition
|
1,769,240
|
43.65
|
−1.52
|
|
|
| Source: AEC
|
Liberal to Labor: Deakin, Menzies
Greens to Labor: Melbourne
Independent to Liberal: Goldstein
|
|---|
|
- Divisions in: New South Wales
- Victoria
- Queensland
- Western Australia
- South Australia
- Tasmania
- Australian Capital and Northern Territories
|
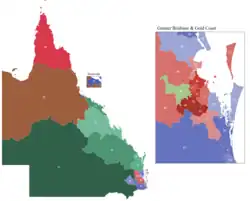
Queensland
2025 Australian federal election
(Queensland)|
|
|
|
|
 |
House of Representatives (IRV) – Turnout 88.66% (CV)
| Party
|
Votes
|
%
|
Swing (pp)
|
Seats
|
Change (seats)
|
|
|
Liberal National
|
1,099,623
|
34.91
|
−4.73
|
16
|
5
|
|
|
Labor
|
975,848
|
30.98
|
+3.56
|
12
|
7
|
|
|
Greens
|
370,313
|
11.76
|
−1.18
|
1
|
2
|
|
|
One Nation
|
247,071
|
7.84
|
+0.35
|
0
|
|
|
|
Trumpet of Patriots
|
103,287
|
3.28
|
+3.00
|
0
|
|
|
|
Family First
|
83,560
|
2.65
|
+2.65
|
0
|
|
|
|
People First
|
60,471
|
1.92
|
+1.92
|
0
|
|
|
|
Katter's Australian
|
51,775
|
1.64
|
−0.25
|
1
|
|
|
|
Legalise Cannabis
|
18,910
|
0.60
|
+0.40
|
0
|
|
|
|
Libertarian
|
6,606
|
0.21
|
−0.76
|
0
|
|
|
|
Animal Justice
|
6,216
|
0.20
|
−0.64
|
0
|
|
|
|
Citizens
|
2,569
|
0.08
|
+0.08
|
0
|
|
|
|
Fusion
|
2,102
|
0.07
|
+0.04
|
0
|
|
|
|
Socialist Alliance
|
1,634
|
0.05
|
−0.08
|
0
|
|
|
|
Independent
|
118,221
|
3.75
|
+1.66
|
0
|
|
|
|
Not affiliated
|
1,435
|
0.05
|
+0.05
|
0
|
|
| Total |
3,149,641 |
100.00 |
– |
30 |
|
|
|
| Invalid/blank votes |
163,467 |
4.93 |
+0.76 |
– |
–
|
| Turnout |
3,313,108 |
88.66 |
+0.50 |
– |
–
|
| Registered voters |
3,738,087 |
– |
– |
– |
–
|
| Two-party-preferred vote
|
|
|
Liberal National
|
1,593,135
|
50.58
|
−3.47
|
|
|
|
|
Labor
|
1,556,506
|
49.42
|
+3.47
|
|
|
| Source: AEC
|
Liberal to Labor: Bonner, Dickson, Forde, Leichhardt, Petrie
Greens to Labor: Brisbane, Griffith
|
|---|
|
- Divisions in: New South Wales
- Victoria
- Queensland
- Western Australia
- South Australia
- Tasmania
- Australian Capital and Northern Territories
|
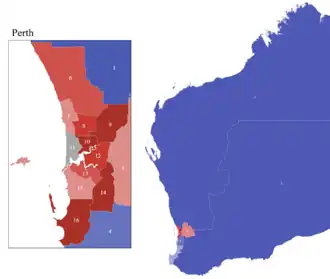
Western Australia
2025 Australian federal election
(Western Australia)|
|
|
|
|
First party
|
Second party
|
|
|
|
|
| Leader
|
Anthony Albanese
|
Peter Dutton
|
| Party
|
Labor
|
Liberal
|
| Last election
|
9 seats
|
5 seats
|
| Seats won
|
11
|
4
|
| Seat change
|
2
|
1
|
| Popular vote
|
568,895
|
458,187
|
| Percentage
|
35.59%
|
28.66%
|
| Swing
|
1.25
|
5.50
|
| TPP
|
55.84%
|
44.16%
|
| TPP swing
|
0.84
|
0.84
|
|
 |
House of Representatives (IRV) – Turnout 88.15% (CV)
| Party
|
Votes
|
%
|
Swing (pp)
|
Seats
|
Change (seats)
|
|
|
Labor
|
568,895
|
35.59
|
−1.25
|
11
|
2
|
|
|
|
Liberal Party of Australia
|
458,187
|
28.66
|
−5.50
|
4
|
1
|
|
|
National Party of Australia
|
46,062
|
2.88
|
+2.26
|
0
|
|
| Coalition total
|
504,249
|
31.54
|
−3.24
|
4
|
1
|
|
|
Greens
|
191,389
|
11.97
|
−0.53
|
0
|
|
|
|
One Nation
|
121,630
|
7.61
|
+3.66
|
0
|
|
|
|
Legalise Cannabis
|
66,547
|
4.16
|
+4.16
|
0
|
|
|
|
Christians
|
31,365
|
1.96
|
+0.61
|
0
|
|
|
|
Trumpet of Patriots
|
9,404
|
0.59
|
−0.49
|
0
|
|
|
|
Citizens
|
2,016
|
0.13
|
+0.13
|
0
|
|
|
|
Socialist Alliance
|
970
|
0.06
|
−0.02
|
0
|
|
|
|
Indigenous-Aboriginal
|
1,872
|
0.12
|
+0.12
|
0
|
|
|
|
Great Australian
|
1,509
|
0.09
|
−1.03
|
0
|
|
|
|
Independent
|
87,987
|
5.50
|
+3.06
|
1
|
|
|
|
Not affiliated
|
10,623
|
0.66
|
+0.66
|
0
|
|
| Total |
1,598,456 |
100.00 |
– |
16 |
1
|
|
|
| Invalid/blank votes |
65,745 |
3.95 |
−1.57 |
– |
–
|
| Turnout |
1,664,201 |
88.15 |
+2.76 |
– |
–
|
| Registered voters |
1,888,877 |
– |
– |
– |
–
|
| Two-party-preferred vote
|
|
|
Labor
|
892,635
|
55.84
|
+0.84
|
|
|
|
|
Liberal
|
705,821
|
44.16
|
−0.84
|
|
|
| Source: AEC
|
Liberal to Labor: Moore
|
|---|
|
- Divisions in: New South Wales
- Victoria
- Queensland
- Western Australia
- South Australia
- Tasmania
- Australian Capital and Northern Territories
|
South Australia
2025 Australian federal election
(South Australia)|
|
|
|
|
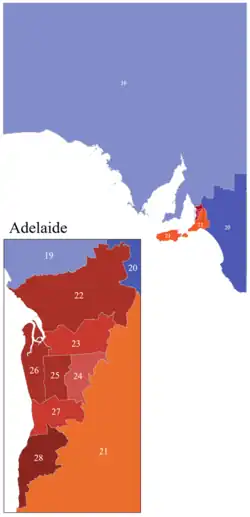 Results by South Australian division for the House of Representatives. |
House of Representatives (IRV) – Turnout 91.47% (CV)[4]
| Party
|
Votes
|
%
|
Swing (pp)
|
Seats
|
Change (seats)
|
|
|
Labor
|
433,738
|
38.31
|
+3.85
|
7
|
1
|
|
|
Liberal
|
316,915
|
27.99
|
–7.32
|
2
|
1
|
|
|
Greens
|
151,915
|
13.42
|
+0.65
|
0
|
|
|
|
One Nation
|
69,650
|
6.15
|
+1.32
|
0
|
|
|
|
Centre Alliance
|
37,453
|
3.31
|
–0.01
|
1
|
|
|
|
Trumpet of Patriots
|
35,793
|
3.16
|
+2.22
|
0
|
|
|
|
Family First
|
29,293
|
2.59
|
+2.59
|
0
|
|
|
|
Animal Justice
|
11,228
|
0.99
|
+0.34
|
0
|
|
|
|
Nationals SA
|
5,181
|
0.46
|
+0.23
|
0
|
|
|
|
Fusion
|
3,009
|
0.27
|
+0.12
|
0
|
|
|
|
Independent
|
38,063
|
3.36
|
+0.67
|
0
|
|
| Total |
1,132,238 |
100.00 |
|
10 |
|
|
|
| Invalid/blank votes |
62,907 |
5.26 |
+0.14 |
– |
–
|
| Turnout |
1,195,145 |
91.47 |
+0.40 |
– |
–
|
| Registered voters |
1,306,900 |
– |
– |
– |
–
|
| Two-party-preferred vote
|
|
|
Labor
|
670,248
|
59.20
|
+5.23
|
7
|
1
|
|
|
Liberal
|
461,990
|
40.80
|
–5.23
|
2
|
1
|
| Source: AEC
|
Liberal to Labor: Sturt
|
|---|
|
- Divisions in: New South Wales
- Victoria
- Queensland
- Western Australia
- South Australia
- Tasmania
- Australian Capital and Northern Territories
|
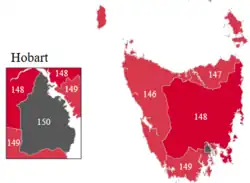
Tasmania
2025 Australian federal election
(Tasmania)|
|
|
|
|
First party
|
Second party
|
|
|
|
|
| Leader
|
Anthony Albanese
|
Peter Dutton
|
| Party
|
Labor
|
Liberal
|
| Last election
|
2 seats
|
2 seats
|
| Seats won
|
4
|
0
|
| Seat change
|
2
|
2
|
| Popular vote
|
134,435
|
89,988
|
| Percentage
|
36.60%
|
24.50%
|
| Swing
|
9.34
|
8.44
|
| TPP
|
63.34%
|
36.66%
|
| TPP swing
|
9.01
|
9.01
|
|
 |
House of Representatives (IRV) – Turnout 93.19% (CV)
| Party
|
Votes
|
%
|
Swing (pp)
|
Seats
|
Change (seats)
|
|
|
Labor
|
134,435
|
36.60
|
+9.34
|
4
|
2
|
|
|
Liberal
|
89,988
|
24.50
|
−8.44
|
0
|
2
|
|
|
Greens
|
40,833
|
11.12
|
−0.88
|
0
|
|
|
|
One Nation
|
22,140
|
6.03
|
+2.04
|
0
|
|
|
|
Trumpet of Patriots
|
9,275
|
2.53
|
+2.53
|
0
|
|
|
|
Shooters, Fishers and Farmers
|
3,457
|
0.94
|
+0.94
|
0
|
|
|
|
Citizens
|
1,224
|
0.33
|
+0.33
|
0
|
|
|
|
Independent
|
65,907
|
17.95
|
+6.80
|
1
|
|
| Total |
367,259 |
100.00 |
|
5 |
|
|
|
| Invalid/blank votes |
16,316 |
4.25 |
−1.60 |
– |
–
|
| Turnout |
383,575 |
93.19 |
+0.76 |
– |
–
|
| Registered voters |
411,681 |
– |
– |
– |
–
|
| Two-party-preferred vote
|
|
|
Labor
|
232,624
|
63.34
|
+9.01
|
4
|
2
|
|
|
Liberal
|
134,635
|
36.66
|
−9.01
|
0
|
2
|
| Source: AEC
|
Liberal to Labor: Bass, Braddon
|
|---|
|
- Divisions in: New South Wales
- Victoria
- Queensland
- Western Australia
- South Australia
- Tasmania
- Australian Capital and Northern Territories
|
Territories
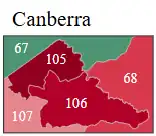
Australian Capital Territory
2025 Australian federal election
(Australian Capital Territory)|
|
|
|
|
First party
|
Second party
|
|
|
|
|
| Leader
|
Anthony Albanese
|
Peter Dutton
|
| Party
|
Labor
|
Liberal
|
| Last election
|
3 seats
|
0 seats
|
| Seats won
|
3
|
0
|
| Seat change
|
|
|
| Popular vote
|
138,110
|
61,489
|
| Percentage
|
47.53%
|
21.16%
|
| Swing
|
2.64
|
5.35
|
| TPP
|
72.49%
|
27.51%
|
| TPP swing
|
5.54
|
5.54
|
|
 |
House of Representatives (IRV) – Turnout 92.41% (CV)
| Party
|
Votes
|
%
|
Swing (pp)
|
Seats
|
Change (seats)
|
|
|
Labor
|
138,110
|
47.53
|
+2.64
|
3
|
|
|
|
Liberal
|
61,489
|
21.16
|
−5.35
|
0
|
|
|
|
Greens
|
43,753
|
15.06
|
−3.61
|
0
|
|
|
|
Family First
|
7,426
|
2.56
|
+2.56
|
0
|
|
|
|
Animal Justice
|
1,258
|
0.43
|
+0.43
|
0
|
|
|
|
HEART
|
1,222
|
0.42
|
+0.42
|
0
|
|
|
|
Independent
|
37,307
|
12.84
|
+8.30
|
0
|
|
| Total |
290,565 |
100.00 |
|
3 |
|
|
|
| Invalid/blank votes |
7,231 |
2.43 |
−0.03 |
– |
–
|
| Turnout |
297,796 |
92.41 |
+0.34 |
– |
–
|
| Registered voters |
322,356 |
– |
– |
– |
–
|
| Two-party-preferred vote
|
|
|
Labor
|
210,627
|
72.49
|
+5.54
|
|
|
|
|
Liberal
|
79,938
|
27.51
|
−5.54
|
|
|
| Source: AEC
|
Northern Territory
2025 Australian federal election
(Northern Territory)|
|
|
|
|
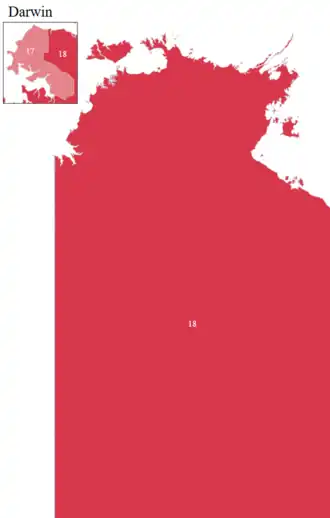 |
House of Representatives (IRV) – Turnout 70.83% (CV)
| Party
|
Votes
|
%
|
Swing (pp)
|
Seats
|
Change (seats)
|
|
|
Labor
|
40,123
|
37.94
|
−0.22
|
2
|
|
|
|
Country Liberal
|
35,785
|
33.84
|
+4.45
|
0
|
|
|
|
Greens
|
10,813
|
10.22
|
−2.84
|
0
|
|
|
|
One Nation
|
8,165
|
7.72
|
+2.35
|
0
|
|
|
|
Citizens
|
1,365
|
1.29
|
+0.80
|
0
|
|
|
|
Indigenous-Aboriginal
|
1,317
|
1.25
|
+1.25
|
0
|
|
|
|
Independent
|
8,194
|
7.75
|
+6.41
|
0
|
|
| Total |
105,762 |
100.00 |
|
2 |
|
|
|
| Invalid/blank votes |
4,397 |
3.99 |
−1.32 |
– |
–
|
| Turnout |
110,159 |
70.83 |
+1.16 |
– |
–
|
| Registered voters |
155,559 |
– |
– |
– |
–
|
| Two-party-preferred vote
|
|
|
Labor
|
57,377
|
54.25
|
–1.29
|
|
|
|
|
Country Liberal
|
48,385
|
45.75
|
+1.29
|
|
|
| Source: AEC
|
|
|---|
|
- Divisions in: New South Wales
- Victoria
- Queensland
- Western Australia
- South Australia
- Tasmania
- Australian Capital and Northern Territories
|
Two party preferred preference flow
House of Representatives (IRV – Turnout 90.70% (CV)
|
|
| Party
|
Coalition
|
Labor
|
| Votes
|
%
|
±
|
Votes
|
%
|
±
|
|
|
Greens
|
223,126
|
11.81%
|
–2.53
|
1,666,851
|
88.19%
|
+2.53
|
|
|
One Nation
|
738,897
|
74.50%
|
+10.2
|
252,917
|
25.50%
|
-10.2
|
|
|
Trumpet of Patriots
|
188,922
|
63.81%
|
|
107,154
|
36.19%
|
|
|
|
Family First
|
177,850
|
64.98%
|
|
95,831
|
35.02%
|
|
|
|
People First
|
55,978
|
77.86%
|
|
15,914
|
22.14%
|
|
|
|
Libertarian
|
60,556
|
72.54%
|
+0.73
|
22,918
|
27.46%
|
-0.73
|
|
|
Animal Justice
|
11,999
|
33.98%
|
–2.13
|
23,313
|
66.02%
|
+2.13
|
|
|
Katter's Australian
|
32,369
|
62.52%
|
+1.21
|
19,406
|
37.48%
|
-1.21
|
|
|
Centre Alliance
|
14,729
|
39.33%
|
-0.43
|
22,724
|
60.67%
|
+0.43
|
|
|
Great Australian
|
901
|
59.71%
|
+7.42
|
608
|
40.29%
|
-7.42
|
|
|
Victorian Socialists
|
2,877
|
12.16%
|
-4.39
|
20,775
|
87.84%
|
+4.39
|
|
|
Informed Medical Options
|
3,537
|
68.84%
|
+15.08
|
1,601
|
31.16%
|
-15.08
|
|
|
Christians
|
23,620
|
75.31%
|
–1.07
|
7,745
|
24.69%
|
+1.07
|
|
|
Shooters, Fishers, Farmers
|
15,570
|
57.74%
|
–0.87
|
11,398
|
42.26%
|
+0.87
|
|
|
Fusion
|
3,711
|
25.82%
|
–4.90
|
10,663
|
74.18%
|
+4.90
|
|
|
Socialist Alliance
|
3,309
|
17.74%
|
-7.61
|
15,344
|
82.26%
|
+7.61
|
|
|
Indigenous-Aboriginal
|
2,083
|
33.03%
|
–14.68
|
4,223
|
66.97%
|
+14.68
|
|
|
Legalise Cannabis
|
72,682
|
39.01%
|
–3.71
|
113,653
|
60.99%
|
+3.71
|
|
|
Citizens
|
9,186
|
44.23%
|
-0.20
|
11,584
|
55.77%
|
+0.20
|
|
|
Democrats
|
221
|
32.12%
|
-1.98
|
467
|
67.88%
|
+1.98
|
|
|
Independents
|
369,855
|
32.85%
|
–3.38
|
756,196
|
67.15%
|
+3.38
|
| Total |
14,659,042 |
100.00 |
|
151 |
|
|
| Two-party-preferred vote
|
|
|
Labor
|
8,553,231
|
55.22
|
+
|
|
|
|
|
Liberal−National Coalition
|
6,937,005
|
44.78
|
−
|
|
|
|
|
| Invalid/blank votes |
|
|
|
– |
–
|
| Turnout |
|
|
|
– |
–
|
| Registered voters |
|
– |
– |
– |
–
|
| Source: AEC for both votes
|
Analysis
Swing table
Notes
References
External links
.jpg)
.jpg)


.jpg)
