2014 Tennessee gubernatorial election
| |||||||||||||||||
| Turnout | 35.97% | ||||||||||||||||
|---|---|---|---|---|---|---|---|---|---|---|---|---|---|---|---|---|---|
| |||||||||||||||||


Haslam: 30–40% 40–50% 50–60% 60–70% 70–80% 80–90% 90%+ Brown: 30–40% 40–50% 50–60% 60–70% 70–80% 80–90% Tie: 50% | |||||||||||||||||
| |||||||||||||||||
| Elections in Tennessee |
|---|
 |
|
|
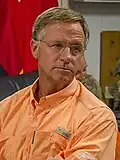
The 2014 Tennessee gubernatorial election took place on November 4, 2014, to elect the governor of Tennessee, alongside other state and local elections. Incumbent Republican governor Bill Haslam was re-elected to a second term with 70.3% of the vote, defeating his Democratic challenger Charles Brown. Improving on his performance from 2010, Haslam also carried every county in the state.
The primary elections took place on August 7, 2014, with Republican Bill Haslam and Democrat Charles Brown winning their respective party nominations.
With no political experience, Charles Brown campaigned on raising speed limits on the interstate highways to 80 mph and putting the Bible back in schools.[2] Some of the Tennessee Democratic Party members became concerned over Brown's candidacy when he said in an interview that he would like to put Bill Haslam in an electric chair and turn it on about half throttle and let him smell a little bit.[2][3][4][5]
Haslam, on the other hand, campaigned on jobs, economic development, education reform, workforce development, and conservative fiscal leadership.[6][7]
As of 2025, this was the best performance in a Tennessee gubernatorial election since Buford Ellington's victory in 1966. This was also the last time a Republican candidate has won Davidson and Shelby counties in a statewide election.
Republican primary
Candidates
Declared
- Basil Marceaux, perennial candidate[8]
- Bill Haslam, incumbent governor[9]
- Donald McFolin, Independent candidate for governor in 2010[10]
- Mark "Coonrippy" Brown[11]
Declined
- John Jay Hooker, political gadfly and Democratic nominee for governor in 1970 and 1998 (ran as an independent)[12]
Results

- 70–80%
- 80–90%
- >90%
| Party | Candidate | Votes | % | |
|---|---|---|---|---|
| Republican | Bill Haslam (incumbent) | 570,997 | 87.68% | |
| Republican | Mark "Coonrippy" Brown | 44,165 | 6.78% | |
| Republican | Donald Ray McFolin | 22,968 | 3.53% | |
| Republican | Basil Marceaux, Sr. | 13,117 | 2.01% | |
| Total votes | 651,247 | 100.00% | ||
Democratic primary
Candidates
Declared
- Charles V. Brown, retired engineer and candidate for governor in 2002[14]
- Kennedy Spellman Johnson[14]
- John McKamey, former Sullivan County Commissioner[14]
- Ron Noonan[14]
Removed from ballot
- Mark E. Clayton, Vice President of Public Advocate of the United States and nominee for U.S. Senate in 2012[15][16]
- Jesse Gore[14]
- Ed Borum[14]
Declined
- Lowe Finney, state senator[17]
- Craig Fitzhugh, minority leader of the Tennessee House of Representatives[18]
- Roy Herron, chairman of the Tennessee Democratic Party, former state senator and nominee for Tennessee's 8th congressional district in 2010[19]
- John Jay Hooker, political gadfly and nominee for governor in 1970 and 1998 (ran as an Independent)[12]
- Jim Kyle, state senator and candidate for governor in 2010[19]
- Sara Kyle, former director of the Tennessee Regulatory Authority[20]
- Mike McWherter, businessman, attorney and nominee for governor in 2010[21]
Results

- 30–40%
- 40–50%
- 50–60%
- 30–40%40–50%
- 50–60%
- 60–70%
| Party | Candidate | Votes | % | |
|---|---|---|---|---|
| Democratic | Charles V. "Charlie" Brown | 95,114 | 41.71% | |
| Democratic | Wm. H. "John" McKamey | 59,200 | 25.96% | |
| Democratic | Kennedy Spellman Johnson | 55,718 | 24.44% | |
| Democratic | Ron Noonan | 17,993 | 7.89% | |
| Total votes | 228,025 | 100.00% | ||
Independents and Third Parties
Candidates
Declared
- Steven Coburn (Independent)[14]
- Shaun Crowell (Constitution)[14]
- John Jay Hooker (Independent), political gadfly and Democratic nominee for governor in 1970 and 1998[14]
- Isa Infante (Green)[14]
- Daniel T. Lewis (Libertarian), educator and nominee for the U.S. Senate in 2008[14]
Removed from ballot
- Jondavid Balunek (Independent)[14]
- J. D. Ellis (Independent)[14]
General election
Predictions
| Source | Ranking | As of |
|---|---|---|
| The Cook Political Report[22] | Solid R | November 3, 2014 |
| Sabato's Crystal Ball[23] | Safe R | November 3, 2014 |
| Rothenberg Political Report[24] | Safe R | November 3, 2014 |
| Real Clear Politics[25] | Safe R | November 3, 2014 |
Polling
| Poll source | Date(s) administered |
Sample size |
Margin of error |
Bill Haslam (R) |
Charles Brown (D) |
Other | Undecided |
|---|---|---|---|---|---|---|---|
| CBS News/NYT/YouGov[26] | October 16–23, 2014 | 974 | ± 5% | 58% | 30% | 2% | 11% |
| CBS News/NYT/YouGov[27] | September 20–October 1, 2014 | 1,007 | ± 4% | 60% | 28% | 1% | 11% |
| CBS News/NYT/YouGov[28] | August 18–September 2, 2014 | 1,056 | ± 4% | 56% | 29% | 4% | 11% |
| Rasmussen Reports[29] | August 11–12, 2014 | 750 | ± 3% | 55% | 30% | 6% | 9% |
Results

| Party | Candidate | Votes | % | ±% | |
|---|---|---|---|---|---|
| Republican | Bill Haslam (incumbent) | 951,796 | 70.31% | +5.28% | |
| Democratic | Charles Brown | 309,237 | 22.84% | −10.24% | |
| Independent | John Jay Hooker | 30,579 | 2.26% | N/A | |
| Constitution | Shaun Crowell | 26,580 | 1.96% | N/A | |
| Green | Isa Infante | 18,570 | 1.37% | N/A | |
| Independent | Steve Coburn | 8,612 | 0.64% | N/A | |
| Independent | Daniel Lewis | 8,321 | 0.62% | N/A | |
| n/a | Write-ins | 33 | 0.00% | 0.00% | |
| Total votes | 1,353,728 | 100.00% | N/A | ||
| Republican hold | |||||
By county
By county
| ||||||||||||||||||||||||||||||||||||||||||||||||||||||||||||||||||||||||||||||||||||||||||||||||||||||||||||||||||||||||||||||||||||||||||||||||||||||||||||||||||||||||||||||||||||||||||||||||||||||||||||||||||||||||||||||||||||||||||||||||||||||||||||||||||||||||||||||||||||||||||||||||||||||||||||||||||||||||||||||||||||||||||||||||||||||||||||||||||||||||||||||||||||||||||||||||||||||||||||||||||||||||||||||||||||||||||||||||||||||||||||||||||||||||||||||||||||||||||||||||||||||||||||||||||||||||||||||||||||||||||||||||||||||||||||||||||||||||||||||||||||||||||||||||||||||||||||||||||||||||||||||||||||||||||||||||||||||||||||||||||||||||||||||||||||||||||||||||||||||||||||||||||||||||||||||||||||||||||||||||||||||||||||||||||||||||||||||||||||||||||||||||||||||
|---|---|---|---|---|---|---|---|---|---|---|---|---|---|---|---|---|---|---|---|---|---|---|---|---|---|---|---|---|---|---|---|---|---|---|---|---|---|---|---|---|---|---|---|---|---|---|---|---|---|---|---|---|---|---|---|---|---|---|---|---|---|---|---|---|---|---|---|---|---|---|---|---|---|---|---|---|---|---|---|---|---|---|---|---|---|---|---|---|---|---|---|---|---|---|---|---|---|---|---|---|---|---|---|---|---|---|---|---|---|---|---|---|---|---|---|---|---|---|---|---|---|---|---|---|---|---|---|---|---|---|---|---|---|---|---|---|---|---|---|---|---|---|---|---|---|---|---|---|---|---|---|---|---|---|---|---|---|---|---|---|---|---|---|---|---|---|---|---|---|---|---|---|---|---|---|---|---|---|---|---|---|---|---|---|---|---|---|---|---|---|---|---|---|---|---|---|---|---|---|---|---|---|---|---|---|---|---|---|---|---|---|---|---|---|---|---|---|---|---|---|---|---|---|---|---|---|---|---|---|---|---|---|---|---|---|---|---|---|---|---|---|---|---|---|---|---|---|---|---|---|---|---|---|---|---|---|---|---|---|---|---|---|---|---|---|---|---|---|---|---|---|---|---|---|---|---|---|---|---|---|---|---|---|---|---|---|---|---|---|---|---|---|---|---|---|---|---|---|---|---|---|---|---|---|---|---|---|---|---|---|---|---|---|---|---|---|---|---|---|---|---|---|---|---|---|---|---|---|---|---|---|---|---|---|---|---|---|---|---|---|---|---|---|---|---|---|---|---|---|---|---|---|---|---|---|---|---|---|---|---|---|---|---|---|---|---|---|---|---|---|---|---|---|---|---|---|---|---|---|---|---|---|---|---|---|---|---|---|---|---|---|---|---|---|---|---|---|---|---|---|---|---|---|---|---|---|---|---|---|---|---|---|---|---|---|---|---|---|---|---|---|---|---|---|---|---|---|---|---|---|---|---|---|---|---|---|---|---|---|---|---|---|---|---|---|---|---|---|---|---|---|---|---|---|---|---|---|---|---|---|---|---|---|---|---|---|---|---|---|---|---|---|---|---|---|---|---|---|---|---|---|---|---|---|---|---|---|---|---|---|---|---|---|---|---|---|---|---|---|---|---|---|---|---|---|---|---|---|---|---|---|---|---|---|---|---|---|---|---|---|---|---|---|---|---|---|---|---|---|---|---|---|---|---|---|---|---|---|---|---|---|---|---|---|---|---|---|---|---|---|---|---|---|---|---|---|---|---|---|---|---|---|---|---|---|---|---|---|---|---|---|---|---|---|---|---|---|---|---|---|---|---|---|---|---|---|---|---|---|---|---|---|---|---|---|---|---|---|---|---|---|---|---|---|---|---|---|---|---|---|---|---|---|---|---|---|---|---|---|---|---|---|---|---|---|---|---|---|---|---|---|---|---|---|---|---|---|---|---|---|---|---|---|---|---|---|---|---|---|---|---|---|---|---|---|---|---|---|---|---|---|---|---|---|---|---|---|---|---|---|---|---|---|---|---|---|---|---|---|---|---|---|---|---|---|---|---|---|---|---|---|---|---|---|---|---|---|---|---|---|---|---|---|---|---|---|---|---|---|---|---|---|---|---|---|---|---|---|---|---|---|---|---|---|---|---|---|---|---|---|---|---|---|---|---|---|---|---|---|---|---|---|---|---|---|---|---|---|---|---|---|---|---|---|---|---|---|---|---|---|---|---|---|---|---|---|---|---|---|---|---|---|---|---|
Counties that flipped from Democratic to Republican
| ||||||||||||||||||||||||||||||||||||||||||||||||||||||||||||||||||||||||||||||||||||||||||||||||||||||||||||||||||||||||||||||||||||||||||||||||||||||||||||||||||||||||||||||||||||||||||||||||||||||||||||||||||||||||||||||||||||||||||||||||||||||||||||||||||||||||||||||||||||||||||||||||||||||||||||||||||||||||||||||||||||||||||||||||||||||||||||||||||||||||||||||||||||||||||||||||||||||||||||||||||||||||||||||||||||||||||||||||||||||||||||||||||||||||||||||||||||||||||||||||||||||||||||||||||||||||||||||||||||||||||||||||||||||||||||||||||||||||||||||||||||||||||||||||||||||||||||||||||||||||||||||||||||||||||||||||||||||||||||||||||||||||||||||||||||||||||||||||||||||||||||||||||||||||||||||||||||||||||||||||||||||||||||||||||||||||||||||||||||||||||||||||||||||
See also
References
- ^ "Tennessee Voter Turnout in 2014". Tennessee Secretary of State. November 4, 2014. Retrieved February 28, 2023.
- ^ a b Murphy, Tim. "Tennessee gubernatorial nominee explains why he wants to electrocute governor". Mother Jones. Retrieved June 10, 2024.
- ^ chattanooga times free press (August 12, 2014). Charlie Brown running for Tennessee governor. Good grief!. Retrieved June 10, 2024 – via YouTube.
- ^ "Dem Gubernatorial Nominee Wants To Send Governor To Electric Chair". HuffPost. August 8, 2014. Retrieved June 10, 2024.
- ^ Hannan, Caleb (August 8, 2014). "The Alvin Greene of 2014". Slate. ISSN 1091-2339. Retrieved June 10, 2024.
- ^ "Priorities". June 11, 2021. Archived from the original on June 11, 2021. Retrieved June 10, 2024.
- ^ "Bill Haslam's Accomplishments". October 21, 2014. Archived from the original on October 21, 2014. Retrieved June 10, 2024.
- ^ "Petitions Filed for Governor, United States Senate, and United States House of Representatives" (PDF). Tennessee Secretary of State. Retrieved April 11, 2014.
- ^ "Gov. Bill Haslam announces re-election campaign". wbir.com. December 17, 2012. Archived from the original on June 18, 2013. Retrieved July 25, 2013.
- ^ "Petitions Filed for Governor, United States Senate, and United States House of Representatives" (PDF). Tennessee Secretary of State. Retrieved April 11, 2014.
- ^ "Mark 'Coonrippy' Brown Runs For Governor To Get His Seized Raccoon Rebekah Back". The Huffington Post. January 6, 2014. Retrieved January 7, 2014.
- ^ a b Dries, Bill (April 2, 2014). "Candidates Commit as Deadline Nears". The Daily News. Retrieved April 2, 2014.
- ^ a b "August 7, 2014 Official Election Results". Tennessee Secretary of State. Archived from the original on September 14, 2014. Retrieved September 15, 2014.
- ^ a b c d e f g h i j k l m "Petitions Filed for Governor, United States Senate, and United States House of Representatives" (PDF). Tennessee Secretary of State. Retrieved April 11, 2014.
- ^ Cass, Michael (April 3, 2014). "Start your engines: Candidates qualify for state races". The Tennessean. Retrieved April 11, 2014.
- ^ Cass, Michael (April 10, 2014). "Won't get fooled again: Democrats deny Mark Clayton". The Tennessean. Retrieved April 11, 2014.
- ^ "Democratic Senator Lowe Finney Won't Seek Re-Election". News Channel 5. July 31, 2013. Archived from the original on September 12, 2013. Retrieved August 7, 2013.
- ^ Zelinski, Andrea (July 22, 2013). "Rep. Fitzhugh passes on run for governor". Nashville City Paper. Archived from the original on August 22, 2013. Retrieved July 24, 2013.
- ^ a b Garrison, Joey (August 12, 2013). "A year out, TN Democrats' search for governor, Senate candidates turning cold". The Tennessean. Retrieved August 20, 2013.
- ^ Sher, Andy (January 2, 2014). "Democrat Sara Kyle won't challenge Gov. Bill Haslam in 2014". Chattanooga Times Free Press. Retrieved January 5, 2014.
- ^ "Mike McWherter: Haslam has created a 'culture of corruption' | Humphrey on the Hill". Knoxblogs.com. September 6, 2013. Retrieved October 6, 2013.
- ^ "2014 Governor Race Ratings for November 3, 2014". The Cook Political Report. Retrieved September 3, 2018.
- ^ "The Crystal Ball's Final 2014 Picks". Sabato's Crystal Ball. November 3, 2014. Retrieved September 3, 2018.
- ^ "2014 Gubernatorial Ratings". Senate Ratings. The Rothenberg Political Report. Retrieved September 3, 2018.
- ^ "2014 Elections Map - 2014 Governors Races". Real Clear Politics. Retrieved September 3, 2018.
- ^ CBS News/NYT/YouGov
- ^ CBS News/NYT/YouGov
- ^ CBS News/NYT/YouGov
- ^ a b Rasmussen Reports
- ^ CBS News/NYT/YouGov
- ^ "State of Tennessee - November 4, 2014 - State General" (PDF). tn.gov. Secretary of State of Tennessee. December 15, 2014.
- ^ "2014 Gubernatorial Results by County" (PDF). Tennessee Secretary of State. November 4, 2014. Retrieved February 18, 2023.
External links
Official campaign websites (Archived)

