2007 Plymouth City Council election
| |||||||||||||||||||||||||||||||||||||||||
19 of the 57 seats to Plymouth City Council 29 seats needed for a majority | |||||||||||||||||||||||||||||||||||||||||
|---|---|---|---|---|---|---|---|---|---|---|---|---|---|---|---|---|---|---|---|---|---|---|---|---|---|---|---|---|---|---|---|---|---|---|---|---|---|---|---|---|---|
| |||||||||||||||||||||||||||||||||||||||||
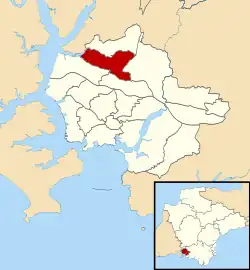
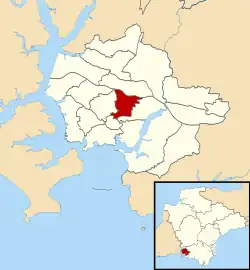
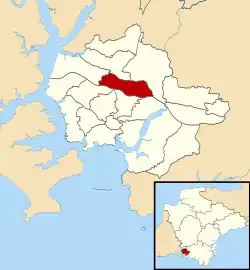
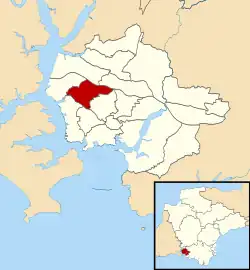
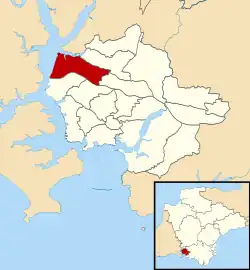
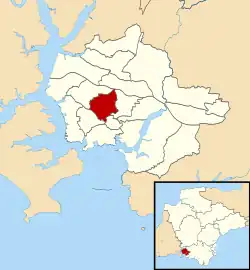
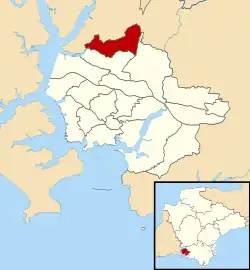
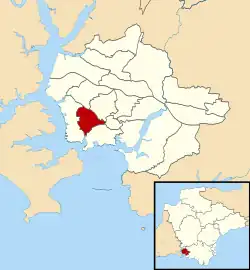
 Map showing the results of contested wards in the 2007 Plymouth City Council elections.
† Councillor John Lock of Plympton Erle ward defected from the Liberal Democrats to the Conservatives in January 2007.[2] | |||||||||||||||||||||||||||||||||||||||||
| |||||||||||||||||||||||||||||||||||||||||
The 2007 Plymouth City Council election was held on 3 May 2007 to elect members of Plymouth City Council in England. One third of the council was up for election and the Conservative Party gained control of the council from the Labour Party.[3][4]
Overall results
| Party | Seats | Gains | Losses | Net gain/loss | Seats % | Votes % | Votes | +/− | |
|---|---|---|---|---|---|---|---|---|---|
| Conservative | 11 | 5 | 0 | 57.9 | 43.1 | 28,199 | |||
| Labour | 8 | 1 | 4 | 42.1 | 29.9 | 19,591 | |||
| Liberal Democrats | 0 | 0 | 2 | 0.0 | 15.2 | 9,959 | |||
| UKIP | 0 | 0 | 0 | 0.0 | 2.9 | 1,896 | |||
| Green | 0 | 0 | 0 | 0.0 | 4.2 | 2,718 | |||
| Independent | 0 | 0 | 0 | 0.0 | 4.0 | 2,597 | |||
| BNP | 0 | 0 | 0 | 0.0 | 0.8 | 498 | |||
| Total | 19 | 65,458 | |||||||
Ward results
Budshead
| Party | Candidate | Votes | % | |
|---|---|---|---|---|
| Conservative | Jonathan Drean | 1,731 | 47.5% | |
| Labour | Michael Fox | 1,387 | 38.0% | |
| Liberal Democrats | Janet Crocker | 528 | 14.5% | |
| Majority | 344 | 9.4% | ||
| Turnout | 3,646 | 38.7% | ||
| Conservative gain from Labour | ||||
Compton
| Party | Candidate | Votes | % | |
|---|---|---|---|---|
| Conservative | David Stark | 2,025 | 52.6% | |
| Liberal Democrats | Steve Smith | 776 | 20.2% | |
| Labour | Margaret Storer | 599 | 15.6% | |
| Green | Josie Bannon | 236 | 6.1% | |
| UKIP | Ronald Coombes | 212 | 5.5% | |
| Majority | 1,249 | 32.5% | ||
| Turnout | 3,848 | 42.8% | ||
| Conservative hold | ||||
Devonport

| Party | Candidate | Votes | % | |
|---|---|---|---|---|
| Labour | Mark Coker | 1,258 | 44.2% | |
| Conservative | Jim Bell | 854 | 30.0% | |
| Liberal Democrats | Sarah Flockton | 416 | 14.6% | |
| UKIP | Syd Brooks | 316 | 11.1% | |
| Majority | 404 | 14.2% | ||
| Turnout | 2,844 | 31.6% | ||
| Labour gain from Liberal Democrats | ||||
Note: The seat was won for Labour the previous time it was contested in 2003, by Bernard Brotherton who subsequently defected to the Liberal Democrats.[5]
Drake

| Party | Candidate | Votes | % | |
|---|---|---|---|---|
| Conservative | Andy Fox | 542 | 31.9% | |
| Liberal Democrats | Karen Gillard | 527 | 31.0% | |
| Labour | Carol Blackburn | 289 | 17.0% | |
| Green | Saul Walker | 137 | 8.1% | |
| Independent | David Santillo | 133 | 7.8% | |
| UKIP | Andrew Leigh | 71 | 4.2% | |
| Majority | 15 | 0.9% | ||
| Turnout | 1,699 | 27.0% | ||
| Conservative gain from Liberal Democrats | ||||
Efford and Lipson

| Party | Candidate | Votes | % | |
|---|---|---|---|---|
| Labour | Claude Miller | 1,346 | 42.4% | |
| Conservative | Mary Orchard | 994 | 31.3% | |
| Liberal Democrats | Stephen Goldthorp | 568 | 17.9% | |
| Green | Tean Mitchell | 263 | 8.3% | |
| Majority | 352 | 11.1% | ||
| Turnout | 3,171 | 33.3% | ||
| Labour hold | ||||
Eggbuckland
| Party | Candidate | Votes | % | |
|---|---|---|---|---|
| Conservative | Lynda Bowyer | 1,847 | 44.6% | |
| Labour | Derick Bray | 1,155 | 27.9% | |
| Independent | Lee Finn | 502 | 12.1% | |
| Liberal Democrats | Robert McVicar | 492 | 11.9% | |
| Green | Raymond Delamare | 141 | 3.4% | |
| Majority | 692 | 16.7% | ||
| Turnout | 4,137 | 40.8% | ||
| Conservative gain from Labour | ||||
Ham
| Party | Candidate | Votes | % | |
|---|---|---|---|---|
| Labour | Tudor Evans | 1,460 | 44.4% | |
| Conservative | Stuart Charles | 1,227 | 37.4% | |
| Liberal Democrats | Emma Swann | 598 | 18.2% | |
| Majority | 233 | 7.1% | ||
| Turnout | 3,285 | 34.2% | ||
| Labour hold | ||||
Honicknowle
| Party | Candidate | Votes | % | |
|---|---|---|---|---|
| Labour | Mark Lowry | 1,272 | 38.2% | |
| Conservative | Edward Delbridge | 753 | 22.6% | |
| Independent | Paul Carter | 669 | 20.1% | |
| Liberal Democrats | Gillian Hirst | 349 | 10.5% | |
| Independent | Ivor Lucas | 178 | 5.3% | |
| Green | Daniel Knaeble | 108 | 3.2% | |
| Majority | 519 | 15.6% | ||
| Turnout | 3,329 | 32.7% | ||
| Labour hold | ||||
Moor View

| Party | Candidate | Votes | % | |
|---|---|---|---|---|
| Labour | Susan Dann | 1,506 | 40.3% | |
| Conservative | Anna Chapman | 1,444 | 38.7% | |
| Liberal Democrats | David Jolly | 357 | 9.6% | |
| Independent | Geoffrey Shepherdson | 292 | 7.8% | |
| Green | Nicola Bannon | 136 | 3.6% | |
| Majority | 62 | 1.7% | ||
| Turnout | 3,735 | 39.8% | ||
| Labour hold | ||||
Peverell
| Party | Candidate | Votes | % | |
|---|---|---|---|---|
| Conservative | John Mahony | 2,228 | 52.5% | |
| Liberal Democrats | Deborah Earl | 792 | 18.7% | |
| Labour | John Sewell | 693 | 16.3% | |
| Green | Don Allen | 349 | 8.2% | |
| UKIP | Graeme Peters | 182 | 4.3% | |
| Majority | 1,436 | 33.8% | ||
| Turnout | 4,244 | 43.4% | ||
| Labour hold | ||||
Plympton Erle
| Party | Candidate | Votes | % | |
|---|---|---|---|---|
| Conservative | Terri Beer | 1,331 | 49.2% | |
| Liberal Democrats | Paul Rowe | 514 | 19.0% | |
| Labour | Ross Burns | 449 | 16.6% | |
| UKIP | John Roberts | 172 | 6.4% | |
| BNP | Mark Cooper | 144 | 5.3% | |
| Green | Colin Bannon | 93 | 3.4% | |
| Majority | 817 | 30.2% | ||
| Turnout | 2,703 | 39.2% | ||
| Liberal Democrats hold | ||||
Plympton St Mary

| Party | Candidate | Votes | % | |
|---|---|---|---|---|
| Conservative | Partick Nicholson | 2,807 | 67.9% | |
| Liberal Democrats | Geoffrey Dustan | 681 | 16.5% | |
| Labour | Steven Lemin | 463 | 11.2% | |
| Green | Nicola Hawker | 186 | 4.5% | |
| Majority | 2,126 | 51.4% | ||
| Turnout | 4,137 | 42.2% | ||
| Conservative hold | ||||
Plymstock Dunstone

| Party | Candidate | Votes | % | |
|---|---|---|---|---|
| Conservative | David Viney | 2,666 | 65.8% | |
| Labour | Kenneth Morrish | 666 | 16.4% | |
| Liberal Democrats | Charlotte Smith | 507 | 12.5% | |
| Green | Wendy Miller | 213 | 5.3% | |
| Majority | 2,000 | 49.4% | ||
| Turnout | 4,052 | 41.0% | ||
| Conservative hold | ||||
Plymstock Radford

| Party | Candidate | Votes | % | |
|---|---|---|---|---|
| Conservative | Ken Foster | 1,958 | 50.8% | |
| Labour | Valerie Burns | 599 | 15.6% | |
| Liberal Democrats | Matthew Radmore | 409 | 10.6% | |
| UKIP | Roger Bullock | 408 | 10.6% | |
| Independent | Roger Dodd | 328 | 8.5% | |
| Green | Colin Trier | 150 | 3.9% | |
| Majority | 1,359 | 35.3% | ||
| Turnout | 3,852 | 41.0% | ||
| Conservative hold | ||||
St Budeaux

| Party | Candidate | Votes | % | |
|---|---|---|---|---|
| Labour | George Wheeler | 1,317 | 42.9% | |
| Conservative | Peter Berrow | 900 | 29.3% | |
| Liberal Democrats | Raymond McSweeney | 437 | 14.2% | |
| Independent | Tom Williams | 416 | 13.6% | |
| Majority | 417 | 13.6% | ||
| Turnout | 3,070 | 32.8% | ||
| Labour hold | ||||
St Peter and the Waterfront

| Party | Candidate | Votes | % | |
|---|---|---|---|---|
| Labour | Mark King | 1,138 | 36.1% | |
| Conservative | Richard Ball | 1,060 | 33.7% | |
| Liberal Democrats | Hugh Janes | 395 | 12.5% | |
| UKIP | Ray Rees | 312 | 9.9% | |
| Green | Clare O'Neill | 166 | 5.3% | |
| Independent | Jo Jo | 79 | 2.5% | |
| Majority | 78 | 2.5% | ||
| Turnout | 3,150 | 33.5% | ||
| Labour hold | ||||
Southway
| Party | Candidate | Votes | % | |
|---|---|---|---|---|
| Conservative | Brian Roberts | 1,547 | 40.1% | |
| Labour | Pauline Murphy | 1,520 | 39.4% | |
| Liberal Democrats | Jane Barwick | 441 | 11.4% | |
| BNP | Robert Perkins | 354 | 9.2% | |
| Majority | 27 | 0.7% | ||
| Turnout | 3,862 | 41.1% | ||
| Conservative gain from Labour | ||||
Stoke
| Party | Candidate | Votes | % | |
|---|---|---|---|---|
| Conservative | Joan Watkins | 1,459 | 39.7% | |
| Labour | Michael Fletcher | 1,182 | 32.2% | |
| Liberal Democrats | Mike Gillbard | 595 | 16.2% | |
| UKIP | Richard Ellison | 223 | 6.1% | |
| Green | Nicholas Byrne | 217 | 5.9% | |
| Majority | 277 | 7.5% | ||
| Turnout | 3,676 | 38.6% | ||
| Conservative gain from Labour | ||||
Sutton and Mount Gould
| Party | Candidate | Votes | % | |
|---|---|---|---|---|
| Labour | Jean Nelder | 1,292 | 42.8% | |
| Conservative | Edmund Shillabeer | 826 | 27.4% | |
| Liberal Democrats | Peter York | 577 | 19.1% | |
| Green | Louise Parker | 323 | 10.7% | |
| Majority | 466 | 15.4% | ||
| Turnout | 3,018 | 32.3% | ||
| Labour hold | ||||
See also
References
- ^ "English local elections 2007 - Plymouth". BBC News.
- ^ "Council defector not to quit seat". BBC News. 25 January 2007.
- ^ "Local elections 2007" (PDF). parliament.uk.
- ^ "Local Election Results 2007". Andrew Teale.
- ^ "Plymouth City Council - Councillors and Committees". Plymouth City Council. Archived from the original on 10 March 2007. Retrieved 20 May 2020.
- ^ "| PLYMOUTH.GOV.UK". www.plymouth.gov.uk.