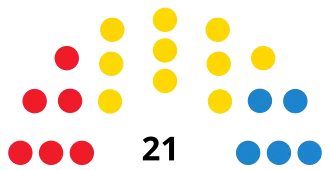
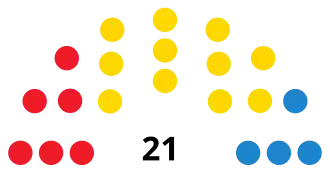
The 2007 Canarian Island Cabildo elections were held on Sunday, 27 May 2007, to elect the 8th Island Cabildos of El Hierro , Fuerteventura , Gran Canaria , La Gomera , La Palma , Lanzarote and Tenerife . All 153 seats in the seven Island Cabildos were up for election.
Overall
← Summary of the 27 May 2007 Island Cabildos election results →
Parties and alliances
Popular vote
Seats
Votes
%
±pp
Total
+/−
Spanish Socialist Workers' Party (PSOE)
289,934
31.46
+5.91
55 +9
Canarian Coalition–Canarian Nationalist Party (CC –PNC )1
231,146
25.08
−10.73
53 −3
People's Party (PP)
219,574
23.83
−6.09
31 −4
New Canaries (NCa)
56,964
6.18
New
6 +6
Canarian Centre (CCN)2
37,510
4.07
+3.75
1 −1
The Greens (Verdes)
11,373
1.23
−1.16
0
±0
Canarian United Left (IUC)
10,085
1.09
−0.09
0
±0
Lanzarote Independents Party (PIL)
10,013
1.09
−0.40
6 −2
Commitment to Gran Canaria (CGCa)
9,933
1.08
New
0
±0
Yes We Can for Tenerife Alternative (ASSPPT)3
8,912
0.97
+0.53
0
±0
The Greens–Green Group (LV–GV)
5,933
0.64
New
0
±0
Canarian Nationalist Alternative (ANC)
2,542
0.28
New
0
±0
25 May Citizens' Alternative (AC25M)
1,869
0.20
−0.15
0
−1
Unity of the People (UP)
1,528
0.17
New
0
±0
United Neighbors (VU)
1,508
0.16
New
0
±0
Alternative Island (ISAL)
1,328
0.14
New
0
±0
Communist Party of the Canarian People (PCPC)
1,306
0.14
+0.02
0
±0
Party of Gran Canaria (PGC)
1,097
0.12
New
0
±0
Nationalist Maga Alternative (AMAGA)
1,066
0.12
New
0
±0
Centre Coalition (CCCAN)
1,043
0.11
New
0
±0
Humanist Party (PH)
762
0.08
−0.04
0
±0
Canarian Nationalist Party (PNC)4
706
0.08
+0.03
1 ±0
Canarian Popular Alternative (APCa)5
663
0.07
−0.07
0
±0
Commitment to Tenerife (CTF)
492
0.05
New
0
±0
Pensionist Assembly of the Canaries (TPC)
470
0.05
±0.00
0
±0
National Democracy (DN)
350
0.04
New
0
±0
Neighborhood Party for Progress (PVPS)
257
0.03
New
0
±0
Blank ballots
13,151
1.43
+0.19
Total
921,515
153
+4
Valid votes
921,515
99.37
−0.07
Invalid votes
5,845
0.63
+0.07
Votes cast / turnout
927,360
61.34
−2.26
Abstentions
584,474
38.66
+2.26
Registered voters
1,511,834
Sources[ 1]
Island Cabildo control
The following table lists party control in the Island Cabildos.[ 1]
Islands
El Hierro
Fuerteventura
← Summary of the 27 May 2007 Island Cabildo of Fuerteventura election results →
Parties and alliances
Popular vote
Seats
Votes
%
±pp
Total
+/−
Canarian Coalition–Canarian Nationalist Party (CC –PNC )
13,539
40.35
+9.65
10 +3
Spanish Socialist Workers' Party (PSOE)
8,071
24.05
−3.20
6 ±0
People's Party (PP)
7,898
23.54
−3.17
5 −1
Canarian Centre –Independents of Fuerteventura (CCN–IF)1
1,454
4.33
−5.17
0
−2
The Greens of the Canaries (Verdes)
1,452
4.33
+1.35
0
±0
New Fuerteventura–New Canaries (NCa)
564
1.68
New
0
±0
Canarian United Left (IUC)
149
0.44
New
0
±0
Blank ballots
431
1.28
+0.26
Total
33,558
21
±0
Valid votes
33,558
98.96
−0.24
Invalid votes
351
1.04
+0.24
Votes cast / turnout
33,909
61.80
−1.97
Abstentions
20,959
38.20
+1.97
Registered voters
54,868
Sources[ 1] [ 3]
Gran Canaria
← Summary of the 27 May 2007 Island Cabildo of Gran Canaria election results →
Parties and alliances
Popular vote
Seats
Votes
%
±pp
Total
+/−
People's Party (PP)
136,502
34.86
−13.22
12 −3
Spanish Socialist Workers' Party (PSOE)
132,767
33.91
+12.81
12 +5
New Canaries–New Gran Canaria (NCa)
51,906
13.26
New
4 +4
Canarian Coalition–Canarian Nationalist Party (CC –PNC )1
20,234
5.17
−19.88
1 −6
Canarian Centre (CCN)
14,944
3.82
New
0
±0
Commitment to Gran Canaria (CGCa)
9,933
2.54
New
0
±0
The Greens of the Canaries (Verdes)
9,921
2.53
+0.35
0
±0
Canarian United Left (IUC)
2,399
0.61
−0.73
0
±0
Unity of the People (UP)
1,528
0.39
New
0
±0
United Neighbors (VU)
1,508
0.39
New
0
±0
Party of Gran Canaria (PGC)
1,097
0.28
New
0
±0
Nationalist Maga Alternative (AMAGA)
1,066
0.27
New
0
±0
Communist Party of the Canarian People (PCPC)
725
0.19
−0.07
0
±0
Canarian Popular Alternative (APCa)
663
0.17
−0.16
0
±0
Pensionist Assembly of the Canaries (TPC)
470
0.12
+0.01
0
±0
Humanist Party (PH)
346
0.09
−0.07
0
±0
Blank ballots
5,545
1.42
+0.14
Total
391,554
29
±0
Valid votes
391,554
99.36
−0.05
Invalid votes
2,516
0.64
+0.05
Votes cast / turnout
394,070
63.16
−4.53
Abstentions
229,876
36.84
+4.53
Registered voters
623,946
Sources[ 1] [ 4]
La Gomera
La Palma
← Summary of the 27 May 2007 Island Cabildo of La Palma election results →
Parties and alliances
Popular vote
Seats
Votes
%
±pp
Total
+/−
Canarian Coalition–Canarian Nationalist Party (CC –PNC )
21,816
46.77
−2.55
11 ±0
Spanish Socialist Workers' Party (PSOE)
12,706
27.24
+4.84
6 +1
People's Party (PP)
7,773
16.66
−4.80
4 −1
Canarian Centre (CCN)
2,030
4.35
New
0
±0
Initiative for La Palma–New Canaries (NCa)1
1,474
3.16
−0.98
0
±0
Canarian United Left (IUC)
451
0.97
New
0
±0
Blank ballots
398
0.85
+0.07
Total
46,648
21
±0
Valid votes
46,648
99.37
−0.15
Invalid votes
295
0.63
+0.15
Votes cast / turnout
46,943
62.01
+2.86
Abstentions
28,758
37.99
−2.86
Registered voters
75,701
Sources[ 1] [ 6]
Lanzarote
← Summary of the 27 May 2007 Island Cabildo of Lanzarote election results →
Parties and alliances
Popular vote
Seats
Votes
%
±pp
Total
+/−
Spanish Socialist Workers' Party (PSOE)
10,494
23.69
+1.03
6 ±0
Lanzarote Independents Party (PIL)
10,013
22.60
−9.20
6 −2
Canarian Coalition (CC)
9,190
20.74
+2.16
6 +1
People's Party (PP)
5,399
12.19
−1.38
3 ±0
Nationalist Party of Lanzarote–New Canaries (NCa)
3,020
6.82
New
2 +2
25 May Citizens' Alternative (AC25M)
1,869
4.22
−3.14
0
−1
Alternative Island (ISAL)
1,328
3.00
New
0
±0
Canarian Centre (CCN)
1,294
2.92
New
0
±0
Canarian Nationalist Party (PNC)
315
0.71
New
0
±0
Neighborhood Party for Progress (PVPS)
257
0.58
New
0
±0
Blank ballots
1,125
2.54
+1.02
Total
44,304
23
±0
Valid votes
44,304
99.33
−0.10
Invalid votes
301
0.67
+0.10
Votes cast / turnout
44,605
56.30
−1.78
Abstentions
34,624
43.70
+1.78
Registered voters
79,229
Sources[ 1] [ 7]
Tenerife
← Summary of the 27 May 2007 Island Cabildo of Tenerife election results →
Parties and alliances
Popular vote
Seats
Votes
%
±pp
Total
+/−
Canarian Coalition–Canarian Nationalist Party (CC –PNC )1
160,028
41.45
−6.76
14 −1
Spanish Socialist Workers' Party (PSOE)
115,744
29.98
+0.10
10 ±0
People's Party (PP)
60,620
15.70
+1.46
5 +1
Canarian Centre (CCN)
16,934
4.39
New
0
±0
Yes We Can for Tenerife Alternative (ASSPPT)2
8,912
2.31
+1.24
0
±0
The Greens –United Left –Citizens' Union–United for Tenerife (LV–IU–UC–UPT)3
7,086
1.84
−2.53
0
±0
The Greens–Green Group (LV–GV)
5,933
1.54
New
0
±0
Canarian Nationalist Alternative (ANC)
2,542
0.66
New
0
±0
Centre Coalition (CCCAN)
1,043
0.27
New
0
±0
Communist Party of the Canarian People (PCPC)
581
0.15
New
0
±0
Commitment to Tenerife (CTF)
492
0.13
New
0
±0
Humanist Party (PH)
416
0.11
−0.01
0
±0
National Democracy (DN)
350
0.09
New
0
±0
Blank ballots
5,402
1.40
+0.15
Total
386,083
29
±0
Valid votes
386,083
99.46
−0.04
Invalid votes
2,102
0.54
+0.04
Votes cast / turnout
388,185
60.01
−1.05
Abstentions
258,732
39.99
+1.05
Registered voters
646,917
Sources[ 1] [ 8]
See also
References


