2003 Russian legislative election
| |||||||||||||||||||||||||||||||||||||||||||||||||||||||||||||||||||||||||||||||||||||||||||||||||||||||||||||||||||||||||||||||||||||||||||||||||||||||||
All 450 seats in the State Duma 226 seats needed for a majority | |||||||||||||||||||||||||||||||||||||||||||||||||||||||||||||||||||||||||||||||||||||||||||||||||||||||||||||||||||||||||||||||||||||||||||||||||||||||||
|---|---|---|---|---|---|---|---|---|---|---|---|---|---|---|---|---|---|---|---|---|---|---|---|---|---|---|---|---|---|---|---|---|---|---|---|---|---|---|---|---|---|---|---|---|---|---|---|---|---|---|---|---|---|---|---|---|---|---|---|---|---|---|---|---|---|---|---|---|---|---|---|---|---|---|---|---|---|---|---|---|---|---|---|---|---|---|---|---|---|---|---|---|---|---|---|---|---|---|---|---|---|---|---|---|---|---|---|---|---|---|---|---|---|---|---|---|---|---|---|---|---|---|---|---|---|---|---|---|---|---|---|---|---|---|---|---|---|---|---|---|---|---|---|---|---|---|---|---|---|---|---|---|---|
| Turnout | 55.75% ( | ||||||||||||||||||||||||||||||||||||||||||||||||||||||||||||||||||||||||||||||||||||||||||||||||||||||||||||||||||||||||||||||||||||||||||||||||||||||||
| |||||||||||||||||||||||||||||||||||||||||||||||||||||||||||||||||||||||||||||||||||||||||||||||||||||||||||||||||||||||||||||||||||||||||||||||||||||||||
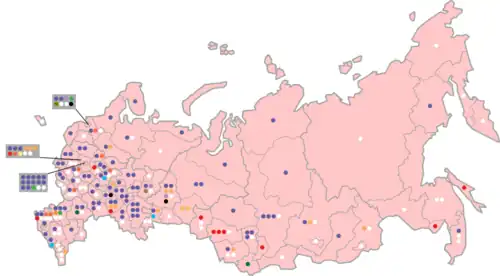
 Winning party by district (PR) | |||||||||||||||||||||||||||||||||||||||||||||||||||||||||||||||||||||||||||||||||||||||||||||||||||||||||||||||||||||||||||||||||||||||||||||||||||||||||
| |||||||||||||||||||||||||||||||||||||||||||||||||||||||||||||||||||||||||||||||||||||||||||||||||||||||||||||||||||||||||||||||||||||||||||||||||||||||||
.jpg)
.jpg)

.jpg)


.jpg)

List
- United RussiaPeople's PartyCommunist PartyRodinaYablokoParty of Rebirth/Party of LifeUnion of Right ForcesAgrarian PartyGreat RussiaNew Course — Automobile RussiaDevelopment of EnterpriseSelf-nominationsSeat not filled
Legislative elections were held in Russia on 7 December 2003.[1] At stake were the 450 seats in the State Duma (Gosudarstvennaya Duma), the lower house of the Federal Assembly.
As expected, the pro-Vladimir Putin United Russia party received the most votes (38%) and won the most seats, gaining a plurality in the Duma. The Communist Party remained the second largest, though much reduced in strength. The Liberal Democratic Party improved its position by 19 seats, while the liberal Yabloko and the liberal-conservative Union of Right Forces lost most of their seats.
Opinion polls
| Polling firm | Fieldwork date | Unity | OVR | CPRF | LDPR | Rodina | Yabloko | SPS | Other | Unsure | Against all |
Wouldn't vote |
Lead |
|---|---|---|---|---|---|---|---|---|---|---|---|---|---|
| United Russia | |||||||||||||
| Election result | 19 Dec 1999 | 23.3 | 13.3 | 24.3 | 5.9 | — | 6.0 | 8.5 | 13.4 | — | 3.3 | — | 1 |
| VCIOM | May 2000 | 26 | 6 | 33 | 4 | — | 8 | 9 | 10[a] | — | 4 | — | 7 |
| VCIOM | 24-27 Nov 2000 | 19 | 6 | 33 | 7 | — | 8 | 8 | 14[b] | — | 4 | — | 14 |
| FOM | 2-3 Dec 2000 | 16 | 3 | 17 | 3 | — | 5 | 5 | — | 27 | 5 | 12 | 1 |
| FOM | 10-11 Feb 2001 | 19 | 7 | 21 | 5 | — | 5 | 3 | 3[c] | 20 | 8 | 8 | 2 |
| FOM | 14-15 Apr 2001 | 19 | 5 | 22 | 6 | — | 5 | 4 | 2[d] | 14 | 8 | 15 | 3 |
| FOM | 21-22 Apr 2001 | 22 | 8 | 21 | 4 | — | 8 | 5 | 3[c] | 13 | 7 | 8 | 1 |
| FOM | 2-3 Jun 2001 | 23 | 5 | 23 | 5 | — | 5 | 5 | 3[c] | 16 | 6 | 11 | Tie |
| FOM | 14-15 Jul 2001 | 22 | 6 | 23 | 5 | — | 4 | 4 | 2[e] | 18 | 7 | 9 | 1 |
| FOM | 8-9 Sep 2001 | 22 | 6 | 23 | 4 | — | 5 | 3 | 2[e] | 20 | 6 | 9 | 1 |
| FOM | 20-21 Oct 2001 | 25 | 6 | 22 | 5 | — | 4 | 3 | 2[e] | 18 | 6 | 10 | 3 |
| FOM | 2-3 Feb 2002 | 21 | 24 | 7 | — | 6 | 4 | 3[c] | 14 | 10 | 10 | 3 | |
| FOM | 20 Jul 2002 | 31 | 22 | 5 | — | 3 | 3 | 2[e] | — | — | — | 9 | |
| VCIOM | 21-27 Aug 2002 | 26 | 34 | 9 | — | 8 | 6 | 13[f] | — | 5 | — | 8 | |
| FOM | 12-13 Oct 2002 | 26 | 23 | 5 | — | 5 | 5 | 3[g] | 15 | 6 | 10 | 3 | |
| VCIOM | 20-23 Dec 2002 | 27 | 27 | 9 | — | 7 | 5 | 22[h] | — | 5 | — | Tie | |
| FOM | 5-6 Apr 2003 | 21 | 22 | 5 | — | 5 | 3 | 4[i] | 25 | 5 | 11 | 1 | |
| FOM | 17 May 2003 | 19 | 21 | 7 | — | 5 | 3 | — | — | — | — | 2 | |
| VCIOM | 23-26 May 2003 | 23 | 28 | 10 | — | 8 | 5 | 7 | 13 | 4 | — | 5 | |
| VCIOM | 20-24 Jun 2003 | 26 | 27 | 6 | — | 8 | 3 | 11[j] | 16 | 3 | — | 1 | |
| VCIOM | 15-18 Aug 2003 | 23 | 28 | 9 | — | 6 | 5 | 10[k] | 12 | 5 | — | 5 | |
| VCIOM-A | 19-22 Sep 2003 | 28 | 23 | 5 | 2 | 5 | 5 | 8[l] | 20 | 5 | — | 5 | |
| FOM | 11 Oct 2003 | 20 | 18 | 7 | 2 | 4 | 4 | 6[m] | 21 | 5 | 13 | 2 | |
| VCIOM-A | 10-13 Oct 2003 | 26 | 26 | 5 | 3 | 5 | 4 | 6[n] | 20 | 5 | — | Tie | |
| VCIOM-A | 24-28 Oct 2003 | 30 | 23 | 5 | 1 | 4 | 6 | 17 | 6 | — | 7 | ||
| VCIOM-A | 13 Nov 2003 | 29 | 23 | 8 | 3 | 6 | 6 | 14 | 5 | — | 6 | ||
| FOM | 8-9 Nov 2003 | 18.7 | 16.3 | 5.1 | 1.2 | 4.2 | 4.5 | 6.0 | 25.6 | 5.9 | 12.4 | 2.4 | |
| FOM | 15-16 Nov 2003 | 19.5 | 14.9 | 6.0 | 2.9 | 3.8 | 4.5 | 6.2 | 24.1 | 5.7 | 12.2 | 4.6 | |
| FOM | 22-23 Nov 2003 | 25.1 | 14.1 | 6.5 | 3.3 | 2.5 | 3.5 | 7.4 | 22.0 | 5.4 | 10.6 | 11 | |
| FOM | 29-30 Nov 2003 | 28.1 | 15.8 | 7.3 | 4.4 | 2.7 | 3.4 | 7.3 | 18.3 | 5.0 | 7.9 | 12.3 | |
Results
 | |||||||||
|---|---|---|---|---|---|---|---|---|---|
| Party | Party-list | Constituency | Total seats | +/– | |||||
| Votes | % | Seats | Votes | % | Seats | ||||
| United Russia | 22,776,294 | 38.16 | 120 | 14,123,625 | 23.95 | 103 | 223 | New | |
| Communist Party | 7,647,820 | 12.81 | 40 | 6,577,598 | 11.15 | 12 | 52 | −61 | |
| Liberal Democratic Party | 6,944,322 | 11.64 | 36 | 1,860,905 | 3.16 | 0 | 36 | +19 | |
| National Patriotic Union "Rodina" | 5,470,429 | 9.17 | 29 | 1,719,147 | 2.92 | 8 | 37 | New | |
| Yabloko | 2,610,087 | 4.37 | 0 | 1,580,629 | 2.68 | 4 | 4 | −16 | |
| Union of Right Forces | 2,408,535 | 4.04 | 0 | 1,764,290 | 2.99 | 3 | 3 | −26 | |
| Agrarian Party | 2,205,850 | 3.70 | 0 | 1,104,974 | 1.87 | 2 | 2 | New | |
| Russian Pensioners' Party–Party of Social Justice | 1,874,973 | 3.14 | 0 | 342,891 | 0.58 | 0 | 0 | −1 | |
| Party of Russia's Rebirth–Russian Party of Life | 1,140,413 | 1.91 | 0 | 1,584,904 | 2.69 | 3 | 3 | New | |
| People's Party | 714,705 | 1.20 | 0 | 2,677,889 | 4.54 | 17 | 17 | New | |
| Conceptual Party "Unity" | 710,721 | 1.19 | 0 | 9,334 | 0.02 | 0 | 0 | New | |
| New Course — Automobile Russia | 509,302 | 0.85 | 0 | 222,090 | 0.38 | 1 | 1 | New | |
| For a Holy Russia | 298,826 | 0.50 | 0 | 59,986 | 0.10 | 0 | 0 | New | |
| Russian Ecological Party "The Greens" | 253,985 | 0.43 | 0 | 69,585 | 0.12 | 0 | 0 | 0 | |
| Development of Enterprise | 212,827 | 0.36 | 0 | 237,527 | 0.40 | 1 | 1 | New | |
| Great Russia – Eurasian Union | 170,796 | 0.29 | 0 | 464,602 | 0.79 | 1 | 1 | New | |
| Genuine Patriots of Russia | 149,151 | 0.25 | 0 | 2,564 | 0.00 | 0 | 0 | New | |
| Party of Peace and Unity | 148,954 | 0.25 | 0 | 10,664 | 0.02 | 0 | 0 | 0 | |
| United Russian Party Rus' | 147,441 | 0.25 | 0 | 570,453 | 0.97 | 0 | 0 | New | |
| Democratic Party | 136,295 | 0.23 | 0 | 94,810 | 0.16 | 0 | 0 | New | |
| Russian Constitutional Democratic Party | 113,190 | 0.19 | 0 | 0 | New | ||||
| Union of People for Education and Science | 107,448 | 0.18 | 0 | 16,111 | 0.03 | 0 | 0 | New | |
| People's Republican Party | 80,420 | 0.13 | 0 | 2,995 | 0.01 | 0 | 0 | New | |
| Other parties | 288,866 | 0.49 | 0 | 0 | – | ||||
| Independents | 15,843,626 | 26.86 | 67 | 67 | −38 | ||||
| Against all | 2,851,958 | 4.78 | – | 7,744,998 | 13.13 | – | – | – | |
| Vacant seats | 3 | 3 | – | ||||||
| Total | 59,684,742 | 100.00 | 225 | 58,975,063 | 100.00 | 225 | 450 | 0 | |
| Valid votes | 59,684,742 | 98.44 | 58,975,063 | 97.93 | |||||
| Invalid/blank votes | 948,435 | 1.56 | 1,247,491 | 2.07 | |||||
| Total votes | 60,633,177 | 100.00 | 60,222,554 | 100.00 | |||||
| Registered voters/turnout | 108,906,250 | 55.67 | 108,906,250 | 55.30 | |||||
| Source: Nohlen & Stöver, IPU, 2003 elections[2] | |||||||||
Legacy
The 2003 election is cited by scholars as a turning point in Russian politics, as it marked the moment the federal parliament effectively became a rubber stamp body.[3][4][5]
Notes
- ^ Women of Russia 4%, People's Republican Party 2%, APR, NDR, RNE 1%, other 1%.
- ^ Women of Russia 7%, Russia, APR 2%, People's Republican Party, RNE 1%, NDR <1%, other 1%.
- ^ a b c d APR 3%, other 0%.
- ^ APR 2%, other 0%.
- ^ a b c d APR 2%.
- ^ Women of Russia 6%, APR, DPR, RNE, Russia 1%, other 3%.
- ^ APR 2%, other 1%.
- ^ Women of Russia 8%, PVR 3%, APR, RNE, RPP, Development of Enterprise 2%, NPRF, Liberal Russia 1%, other 1%.
- ^ APR 3%, other 1%.
- ^ PVR, Greens 2%, APR, NPRF, RPP, DPR, RNE, SDPR 1%, other 1%.
- ^ APR 4%, PVR 3%, Greens, NPRF, RPP 1%, other <1%.
- ^ APR, Greens 2%, NPRF, PVR-RPZh, DPR 1%, other 1%.
- ^ APR, PVR-RPZh 2%, NPRF, Great Russia—Eurasian Union 1%, New Cource 0%.
- ^ APR 2%, Greens, PVR-RPZh, DPR, NPRF 1%.
References
- ^ Dieter Nohlen & Philip Stöver (2010) Elections in Europe: A data handbook, p1642 ISBN 978-3-8329-5609-7
- ^ Сведения о зарегистрированных депутатах ГД ФС РФ четвертого созыва по одномандатным избирательным округам Archived 2006-10-16 at the Wayback Machine (in Russian)
- ^ Rosefielde, Steven; Hedlund, Stefan (2009). Russia Since 1980. Cambridge University Press. p. 174. ISBN 9780521849135. Retrieved 23 September 2023.
Duma election of 2003, reducing the legislature to a rubber stamp.
- ^ Troianovski, Anton; Nechepurenko, Ivan (19 September 2021). "Russian Election Shows Declining Support for Putin's Party". The New York Times. ISSN 0362-4331. Archived from the original on 20 September 2021. Retrieved 27 September 2021.
- ^ China Russia Compared wesleyan.edu July 2015
External links
- Election results – official information Archived 10 December 2018 at the Wayback Machine (in Russian)
| Presidential elections | |
|---|---|
| Legislative elections | |
| Gubernatorial elections | |
| Regional elections | |
| Referendums | |
| |