Elections in the Republic of India in 1993 included elections to nine state legislative assemblies and to seats in the Rajya Sabha.
Overall Result
Legislative Assembly elections
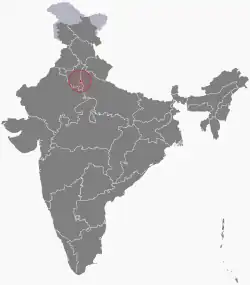
Delhi
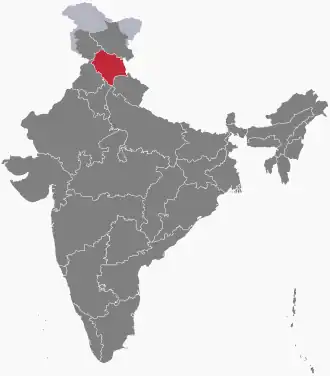
Himachal Pradesh
 |
|---|
| Party | Votes | % | Seats | +/– |
|---|
| Indian National Congress | 1,135,203 | 48.82 | 52 | +43 |
| Bharatiya Janata Party | 840,233 | 36.13 | 8 | –38 |
| Communist Party of India (Marxist) | 17,347 | 0.75 | 1 | +1 |
| Others | 105,475 | 4.54 | 0 | 0 |
| Independents | 227,050 | 9.76 | 7 | +6 |
| Total | 2,325,308 | 100.00 | 68 | 0 |
|
| Valid votes | 2,325,308 | 99.22 | |
|---|
| Invalid/blank votes | 18,305 | 0.78 | |
|---|
| Total votes | 2,343,613 | 100.00 | |
|---|
| Registered voters/turnout | 3,277,625 | 71.50 | |
|---|
| Source: ECI[2] |
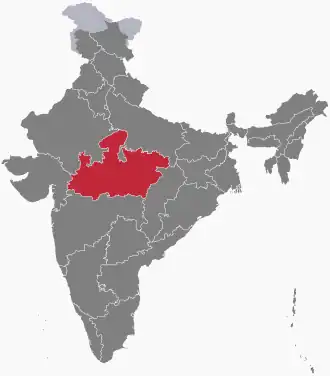
Madhya Pradesh
Source:[3]
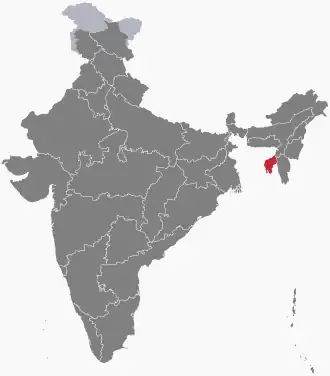
Meghalaya
← Summary of the 19 February 1993 Meghalaya Legislative Assembly election results →
| Parties and coalitions
|
Popular vote
|
Seats
|
| Votes
|
%
|
±pp
|
Won
|
+/−
|
|
|
Indian National Congress (INC)
|
282,139 |
34.62 |
1.97 
|
24 |
2
|
|
|
Hill People's Union (HPU)
|
175,487
|
21.53
|
5.31 
|
11
|
8
|
|
|
Hill State People's Democratic Party (HDP)
|
79,824
|
9.8
|
2.88
|
8
|
2
|
|
|
All Party Hill Leaders Conference (Armison Marak Group)
|
64,603
|
7.93
|
3.25
|
3
|
1
|
|
|
Bharatiya Janata Party (BJP)
|
29,948
|
3.68
|
|
0
|
|
|
|
Meghalaya Progressive People's Party (MPPP)
|
20,117
|
2.47
|
|
2
|
|
|
|
Public Demands Implementation Convention (PDIC)
|
17,423
|
2.14
|
1.06
|
2
|

|
|
|
Janata Dal (B)
|
2,586
|
0.32
|
|
0
|
|
|
|
Communist Party of India (CPI)
|
1,138
|
0.14
|
0.22
|
0
|
|
|
|
Janata Party
|
841
|
0.1
|
|
0
|
|
|
|
Independents (IND)
|
140,793 |
17.28 |
2.31
|
10 |
1
|
|
|
| Total
|
814,899 |
100.00 |
|
60 |
±0
|
| Source: Election Commission of India[4]
|
Mizoram
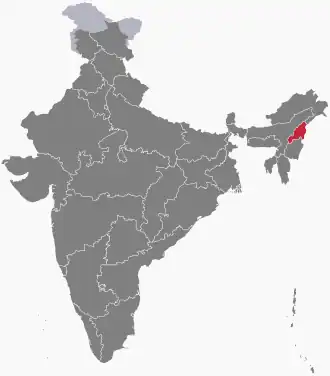
Nagaland
 |
|---|
| Party | Votes | % | Seats | +/– |
|---|
| Indian National Congress | 335,834 | 45.95 | 35 | –1 |
| Nagaland Peoples Council | 239,505 | 32.77 | 17 | New |
| Democratic Labour Party | 3,755 | 0.51 | 1 | New |
| Bharatiya Janata Party | 3,755 | 0.51 | 0 | New |
| Independents | 148,074 | 20.26 | 7 | +7 |
| Total | 730,923 | 100.00 | 60 | 0 |
|
| Valid votes | 730,923 | 99.29 | |
|---|
| Invalid/blank votes | 5,206 | 0.71 | |
|---|
| Total votes | 736,129 | 100.00 | |
|---|
| Registered voters/turnout | 802,911 | 91.68 | |
|---|
| Source: ECI[6] |
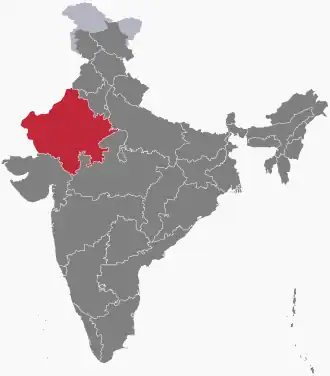
Rajasthan
Source:[7]
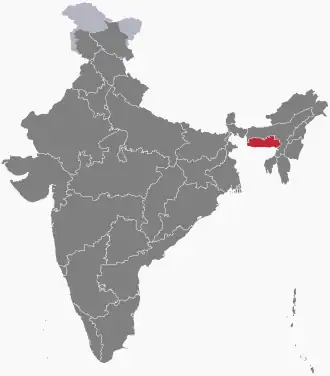
Tripura
Performance of the political parties in this election
| Party
|
Seats Contested
|
Seats Won
|
No. of Votes
|
% of Votes
|
1988 Seats
|
| Bharatiya Janata Party
|
38
|
0
|
27,078
|
2.02%
|
0
|
| Communist Party of India
|
2
|
0
|
18,058
|
1.35%
|
0
|
| Communist Party of India (Marxist)
|
51
|
44
|
599,943
|
44.78%
|
26
|
| Indian National Congress
|
46
|
10
|
438,561
|
32.73%
|
25
|
| Janata Dal(B)
|
2
|
1
|
20,981
|
1.57%
|
-
|
| All India Forward Block
|
1
|
1
|
10,658
|
0.80%
|
0
|
| Revolutionary Socialist Party
|
2
|
2
|
21,235
|
1.58%
|
2
|
| Tripura Upajati Juba Samiti
|
14
|
1
|
100,742
|
7.52%
|
-
|
| Amra Bangali
|
42
|
0
|
19,592
|
1.46%
|
-
|
| Independents
|
207
|
1
|
82,541
|
6.16%
|
0
|
| Total
|
407
|
60
|
1,339,838
|
|
|
Source:[8]
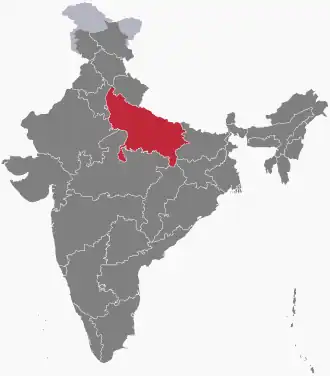
Uttar Pradesh
Source:[9]
| Party Name
|
Seats
|
| Bharatiya Janata Party (BJP)
|
177
|
| Samajwadi Party (SP)
|
109
|
| Bahujan Samaj Party (BSP)
|
67
|
| Communist Party of India (CPI)
|
3
|
| Communist Party of India (Marxist) (CPM)
|
1
|
| Indian National Congress (INC)
|
28
|
| Janata Dal (JD)
|
27
|
| Janata Party (JP)
|
1
|
| Uttarakhand Kranti Dal (UKD)
|
1
|
| Independents
|
8
|
| Total
|
422
|
Rajya Sabha
References
External links
|
|---|
| General elections | |
|---|
| State elections | |
|---|
- See also: Elections in the Andaman and Nicobar Islands
- Andhra Pradesh
- Arunachal Pradesh
- Assam
- Bihar
- Chhattisgarh
- Chandigarh
- Delhi
- Goa
- Gujarat
- Haryana
- Himachal Pradesh
- Jammu and Kashmir
- Jharkhand
- Karnataka
- Kerala
- Madhya Pradesh
- Maharashtra
- Manipur
- Meghalaya
- Mizoram
- Nagaland
- Odisha
- Puducherry
- Punjab
- Rajasthan
- Sikkim
- Tamil Nadu
- Telangana
- Tripura
- Uttar Pradesh
- Uttarakhand
- West Bengal
Presidential elections
- Vice presidential elections
- Rajya Sabha elections
|