1988 Baden-Württemberg state election
| |||||||||||||||||||||||||||||||||||||||||||||||||||||||||||||||||||||||||||
All 125 seats in the Landtag of Baden-Württemberg 63 seats needed for a majority | |||||||||||||||||||||||||||||||||||||||||||||||||||||||||||||||||||||||||||
|---|---|---|---|---|---|---|---|---|---|---|---|---|---|---|---|---|---|---|---|---|---|---|---|---|---|---|---|---|---|---|---|---|---|---|---|---|---|---|---|---|---|---|---|---|---|---|---|---|---|---|---|---|---|---|---|---|---|---|---|---|---|---|---|---|---|---|---|---|---|---|---|---|---|---|---|
| Turnout | 4,933,846 (71.79%) | ||||||||||||||||||||||||||||||||||||||||||||||||||||||||||||||||||||||||||
| |||||||||||||||||||||||||||||||||||||||||||||||||||||||||||||||||||||||||||
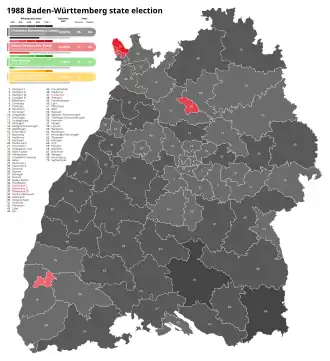 Results for the single-member constituencies | |||||||||||||||||||||||||||||||||||||||||||||||||||||||||||||||||||||||||||
| |||||||||||||||||||||||||||||||||||||||||||||||||||||||||||||||||||||||||||


.jpg)

The 1988 Baden-Württemberg state election was held on 20 March 1988 to elect the members of the 9th Landtag of Baden-Württemberg. The incumbent Christian Democratic Union (CDU) government under Minister-President Lothar Späth was re-elected, retaining its majority. The overall results were not significantly different from the 1984 Baden-Württemberg state election, although all four major parties received a smaller proportion of the vote.
Parties
The table below lists parties represented in the previous Landtag of Baden-Württemberg.
| Name | Ideology | Leader(s) | 1984 result | |||
|---|---|---|---|---|---|---|
| Votes (%) | Seats | |||||
| CDU | Christian Democratic Union of Germany Christlich Demokratische Union Deutschlands |
Christian democracy | Lothar Späth | 51.87% | 68 / 126
| |
| SPD | Social Democratic Party of Germany Sozialdemokratische Partei Deutschlands |
Social democracy | Dieter Spöri | 32.41% | 41 / 126
| |
| Grüne | The Greens Die Grünen |
Green politics | Birgitt Bender | 8.01% | 9 / 126
| |
| FDP | Free Democratic Party Freie Demokratische Partei |
Classical liberalism | Walter Döring | 7.17% | 8 / 126
| |
Results
| Party | Votes | % | +/- | Seats | +/- | Seats % | |
|---|---|---|---|---|---|---|---|
| Christian Democratic Union (CDU) | 2,392,626 | 49.05 | 66 | 52.80 | |||
| Social Democratic Party (SPD) | 1,562,678 | 32.05 | 42 | 33.60 | |||
| The Greens (Grüne) | 383,099 | 7.85 | 10 | 8.00 | |||
| Free Democratic Party (FDP) | 285,932 | 5.86 | 7 | 5.60 | |||
| National Democratic Party (NPD) | 101,889 | 2.09 | New | 0 | ±0 | 0 | |
| Ecological Democratic Party (ÖDP) | 69,823 | 1.43 | New | 0 | ±0 | 0 | |
| The Republicans (REP) | 46,904 | 0.96 | New | 0 | ±0 | 0 | |
| German Communist Party (DKP) | 11,406 | 0.23 | 0 | ±0 | 0 | ||
| Christian League | 6,651 | 0.14 | New | 0 | ±0 | 0 | |
| Patriots for Germany | 4,757 | 0.10 | New | 0 | ±0 | 0 | |
| Centre Party | 1,185 | 0.02 | New | 0 | ±0 | 0 | |
| Free German Workers' Party | 54 | 0.00 | 0 | ±0 | 0 | ||
| Total | 4,878,062 | 98.87 | 145 | ||||
| Invalid votes | 55,784 | 1.13 | |||||
| Voter turnout | 4,949,199 | 71.79 | |||||
Sources
| Baden-Württemberg | |
|---|---|
| Baden | |
| Württemberg | |
| Coburg | |
| Municipal elections |
|
| Referendums | |
| |