1984 European Parliament election
| |||||||||||||||||||||||||||||||||||||||||||||||||||||||||||||||||||||||||||||||||||||
All 434 seats to the European Parliament 218 seats needed for a majority | |||||||||||||||||||||||||||||||||||||||||||||||||||||||||||||||||||||||||||||||||||||
|---|---|---|---|---|---|---|---|---|---|---|---|---|---|---|---|---|---|---|---|---|---|---|---|---|---|---|---|---|---|---|---|---|---|---|---|---|---|---|---|---|---|---|---|---|---|---|---|---|---|---|---|---|---|---|---|---|---|---|---|---|---|---|---|---|---|---|---|---|---|---|---|---|---|---|---|---|---|---|---|---|---|---|---|---|---|
| Turnout | 61% | ||||||||||||||||||||||||||||||||||||||||||||||||||||||||||||||||||||||||||||||||||||
| |||||||||||||||||||||||||||||||||||||||||||||||||||||||||||||||||||||||||||||||||||||
 Post-election composition of each member state's delegation * The number of seats was increased from 410 to 434 – so this is a nominal figure | |||||||||||||||||||||||||||||||||||||||||||||||||||||||||||||||||||||||||||||||||||||
| |||||||||||||||||||||||||||||||||||||||||||||||||||||||||||||||||||||||||||||||||||||
.jpg)
.jpg)

.jpg)

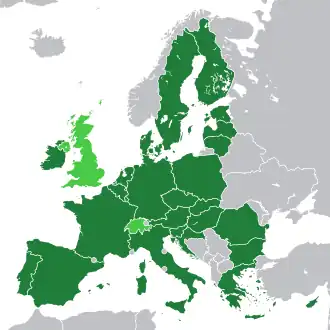
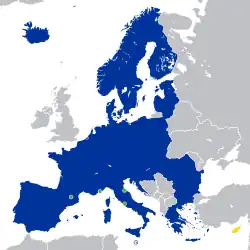
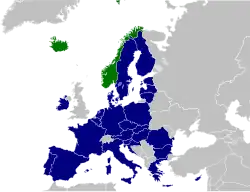
The 1984 European Parliament election was the first since the inaugural election of 1979 and the 1981 enlargement of the European Community to include Greece. It was also the last before the accession of Spain and Portugal in 1986.
Results showed centre-left and right-wing MEPs profiting at the expense of the far-left and centre-right. The Socialists consolidated their position as the biggest group in the Parliament, and there were notable changes for the smaller groups, with far-right MEPs forming a group and the coalescence of the Green and Regionalist group known as "Rainbow". Overall turnout dropped to 61%. No majority was achieved.
Electoral system
There was no single voting system for all member states; each of them adopted its own method, established by national law.
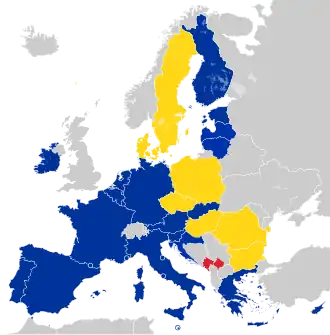
The United Kingdom used a one-round (first-past-the-post) system of 78 constituencies in England, Wales and Scotland, while in Northern Ireland 3 proportional seats were allocated. Belgium, Ireland and Italy used a proportional system with subdivision of the territory into constituencies. Denmark, France, West Germany, Greece, Luxembourg and the Netherlands used a single national proportional system, although in the case of Denmark Greenland had its own constituency with the allocation of one seat and in the case of West Germany the three seats for the West Berlin area were not directly elected but were chosen by the Berlin House of Representatives, given the particular status of the city.
Pre-election
Seat changes
The number of seats was the same as before for each member state that took part in the 1979 election. Greece, which had joined in 1981, was allocated 24 new seats. This raised the number of seats to 434 from 410.
| National distribution of seats | ||||
|---|---|---|---|---|
| State | Seats | State | Seats | |
| 81 | 24 | |||
| 81 | 24 | |||
| 81 | 16 | |||
| 81 | 15 | |||
| 25 | 6 | |||
Campaign
Election and regrouping
Overview
The Socialists increased their share by six seats to 130 seats, up from 124 before the elections. The Democratic Alliance (formerly Progressive Democrats) also made gains, up by seven to 29 seats. The People's Party's, the European Democrats, Communists and Liberals all lost seats. The French National Front and the Italian Social Movement founded a group called the "European Right": the first far-right group in the Parliament. The Technical Group of Independents was replaced by the Rainbow Group, a mixture of Greens and Regionalists.
Final results
| 1984 European Parliament election - Groups at 23–26 July 1984 | ||||||
|---|---|---|---|---|---|---|
| Group | Description | Chaired by | MEPs | |||
| SOC | Social Democrats | Rudi Arndt | 130 | 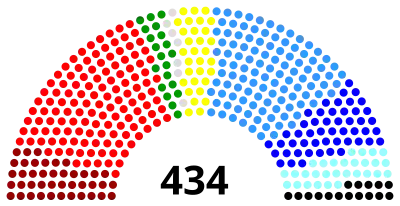
| ||
| EPP | Christian Democrats | Egon Klepsch | 110 | |||
| ED | Conservatives | Henry Plumb | 50 | |||
| COM | Communists and the Far Left | Gianni Cervetti | 41 | |||
| LD | Liberals and Liberal Democrats | Simone Veil | 31 | |||
| EDA | National Conservatives | Christian de La Malène | 29 | |||
| RBW | Greens and Regionalists | Else Hammerich Jaak Vandemeulebroucke Bram van der Lek Paul Staes |
20 | |||
| ER | Far Right Nationalists | Jean-Marie Le Pen | 16 | |||
| NI | Independents | none | 7 | Total: 434 | Sources: [1][2] Archived 27 February 2008 at the Wayback Machine | |
Results by country
| Group Nation |
SOC | EPP | ED | COM | LD | EDA | RBW | ER | NI | Total |
|---|---|---|---|---|---|---|---|---|---|---|
| Belgium | 4 PS 3 SP |
4 CVP 2 PSC |
3 PRL 2 PVV |
2 VU 1 Agalev 1 Ecolo |
2 Ind. | 24 | ||||
| Denmark | 3 A 1 Siu |
1 D | 4 C | 1 SF | 2 V | 4 N | 16 | |||
| France | 20 PS | 7 UDF 2 UDF (CDS) |
10 PCF | 6 UDF (PR) 5 UDF 1 UDF (PRV) |
20 RPR | UPC | 10 FN | 81 | ||
| Greece | 10 PASOK | 9 ND | 3 KKE 1 KKE–E |
1 EPEN | 24 | |||||
| Ireland | 6 FG | 1 Ind. | 8 FF | 15 | ||||||
| Italy | 9 PSI 3 PSDI |
26 DC 1 SVP |
26 PCI | 3 PLI 2 PRI |
1 PdUP 1 DP 1 PSd'Az |
5 MSI | 3 PR | 81 | ||
| Luxembourg | 2 LSAP | 3 CSV | 1 DP | 6 | ||||||
| Netherlands | 9 PvdA | 8 CDA | 5 VVD | 1 PSP 1 PPR |
1 SGP | 25 | ||||
| United Kingdom | 32 LAB 1 SDLP |
45 CON 1 UUP |
1 SNP | 1 DUP | 81 | |||||
| West Germany | 33 SPD | 34 CDU 7 CSU |
7 Grünen | 81 | ||||||
| Total | 130 | 110 | 50 | 41 | 31 | 29 | 20 | 16 | 7 | 434 |
Statistics
| European Parliament election, 1984 - statistics | ||||||||
|---|---|---|---|---|---|---|---|---|
| Area | Dates | Seats | Electorate | Turnout | Previous | Next | Election methods | Sources |
| European Community (EC-10) |
14, 17 June 1984 |
434 | 200,505,752 | 61% | 1979 | 1989 | All PR, except UK (not NI) which used FPTP |
[3] Archived 25 March 2009 at the Wayback Machine [4] Archived 11 September 2008 at the Wayback Machine [5] |
| European Parliament election, 1984 - timeline | |||||||||
|---|---|---|---|---|---|---|---|---|---|
| First Parliament | 1984 election and regrouping | Second Parliament | |||||||
| Groups | Pre-elections January 1 |
Change | Results July 23 |
New groups |
First session July 23 | ||||
| SOC | 124 | +6 | 130 | SOC | 130 | ||||
| EPP | 117 | -7 | 110 | EPP | 110 | ||||
| ED | 63 | -13 | 50 | ED | 50 | ||||
| COM | 48 | -7 | 41 | COM | 41 | ||||
| LD | 38 | -7 | 31 | LD | 31 | ||||
| EPD | 22 | +7 | 29 | EDA | 29 | ||||
| CDI | 12 | +8 | 20 | RBW | 20 | ||||
| NI | 10 | +13 | 7 | NI | 7 | ||||
| 16 | ER | 16 | |||||||
| Total | 434 | +0 | 434 | Total | 434 | ||||
| Sources: [6] Archived 11 September 2008 at the Wayback Machine [7] Archived 27 February 2008 at the Wayback Machine [8] | |||||||||
| European Parliament election, 1984 - Delegation at 23 July 1984 | |||||
|---|---|---|---|---|---|
| Group | Description | Details | % | MEPs | |
| SOC | Social Democrats | West Germany 33, Belgium 7, Denmark 4, France 20, Italy 12, Luxembourg 2, Netherlands 9, UK 33, Greece 10 | 30% | 130 | |
| EPP | Christian Democrats | West Germany 41, Belgium 6, Denmark 1, France 9, Ireland 6, Italy 27, Luxembourg 3, Netherlands 8, Greece 9 | 25% | 110 | |
| ED | Conservatives | Denmark 4, UK 46 | 12% | 50 | |
| COM | Communists and the Far Left | Denmark 1, France 10, Italy 26, Greece 4 | 9% | 41 | |
| LD | Liberals and Liberal Democrats | Belgium 5, Denmark 2, France 12, Ireland 1, Italy 5, Luxembourg 1, Netherlands 5 | 7% | 31 | |
| EDA | National Conservatives | France 20, Ireland 8, UK 1 | 7% | 29 | |
| RBW | Greens and Regionalists | West Germany 7, Belgium 4, Denmark 4, Italy 3, Netherlands 2 | 5% | 20 | |
| ER | Far-Right Nationalists | France 10, Italy 5, Greece 1 | 4% | 16 | |
| NI | Independents | Belgium 2, Italy 3, Netherlands 1, UK 1 | 2% | 7 | |
| Sources: [9] [10] Archived 27 February 2008 at the Wayback Machine | 100% | 434 | |||
Post-election
External links
- Special issue of Electoral Studies on the elections.
- The election of the Members of the European Parliament European Navigator
- Full Election Details Elections Online (In French)
| 1979 | |
|---|---|
| 1989 | |
| 1994 | |
| 1999 | |
| 2004 | |
| 2009 | |
| 2014 | |
| 2019 | |
| 2024 | |
| 2029 |
|
| Off-year | |
| 1952–1958 |
|
|---|---|
| 1958–1979 |
|
| 1979–1984 | |
| 1984–1989 | |
| 1989–1994 | |
| 1994–1999 | |
| 1999–2004 | |
| 2004–2009 | |
| 2009–2014 | |
| 2014–2019 | |
| 2019–2024 | |
| 2024–2029 | |
| Women |
|
| Delegations |
|
| Observers | |
- ^ Including two indirectly elected members from West Berlin
- ^ Confrontation with the 1981 Results
- ^ As part of the UDF-RPR list
- ^ Only members of UDF who were part of the EPP group
- ^ Marius Autran and Jean-Claude Autran. "Elections européennes du 17 juin 1984 (2e législature)". http:jcautran.free.fr. Retrieved 8 October 2024.
- ^ Laurent de Boissieu. "Élections européennes 1984". https:www.france-politique.fr. France Politique. Retrieved 8 October 2024.
- ^ Member of the European Democrats at the 1979 election
- ^ Taking into account the Greek MEPs elected in 1981
- ^ Including one indirectly elected member from West Berlin
- ^ Confrontation with the 1981 Results
- ^ Taking into account the Greek MEPs elected in 1981
- ^ Confrontation with the 1981 Results
- ^ Confrontation with the 1981 Results
- ^ Taking into account the Greek MEPs elected in 1981
- ^ Dimitri Almeida (2012). The Impact of European Integration on Political Parties: Beyond the Permissive Consensus. Taylor & Francis. pp. 102–103. ISBN 978-1-136-34039-0.
- ^ "ELECTION OF THE EUROPEAN PARLIAMENT 17 JUNE 1984 (in Italian)" (PDF). lipari.istat.it. ISTAT. Retrieved 25 June 2024.
- ^ As part of the UDF-RPR list
- ^ Only members of UDF who were part of the EPP group
- ^ Marius Autran and Jean-Claude Autran. "Elections européennes du 17 juin 1984 (2e législature)". http:jcautran.free.fr. Retrieved 8 October 2024.
- ^ Laurent de Boissieu. "Élections européennes 1984". https:www.france-politique.fr. France Politique. Retrieved 8 October 2024.
- ^ "Thomas Joseph MAHER". www.europarl.europa.eu. European Parliament. Retrieved 25 June 2024.
- ^ "European Election: June 1984, Munster, European Parliament". www.electionsireland.org. Retrieved 17 August 2025.
- ^ Confrontation with the 1981 Results
- ^ "List of Danish MEPs (in Danish) on Wayback Machine" (PDF). www.europarl.dk. European Parliament. Retrieved 25 June 2024.
- ^ As part of the UDF-RPR list
- ^ Only members of UDF who were part of the EPP group
- ^ Marius Autran and Jean-Claude Autran. "Elections européennes du 17 juin 1984 (2e législature)". http:jcautran.free.fr. Retrieved 8 October 2024.
- ^ Laurent de Boissieu. "Élections européennes 1984". https:www.france-politique.fr. France Politique. Retrieved 8 October 2024.
- ^ In comparison with the European Progressive Democrats' result in 1979
- ^ Part of the Non-Inscrits at the 1979 election
- ^ Member of the Technical Group of Independents at the 1979 election
- ^ Member of the Technical Group of Independents at the 1979 election
- ^ Member of the Technical Group of Independents at the 1979 election
- ^ Including the Communist Party of the Netherlands, member of the Communists and Allies Group at the 1979 election
- ^ Member of the Technical Group of Independents at the 1979 election
- ^ Luciana Castellina, elected in the Italian Communist Party's list
- ^ "Europee 17/06/1984 - Area ITALIA + ESTERO - Circoscrizione ITALIA NORD-ORIENTALE". elezionistorico.interno.gov.it. Eligendo. Retrieved 18 August 2025.
- ^ "Luciana CASTELLINA". www.europarl.europa.eu. European Parliament. Retrieved 18 August 2025.
- ^ Member of the Technical Group of Independents at the 1979 election
- ^ Member of the Technical Group of Independents at the 1979 election
- ^ elected in the Socialist Party's French list
- ^ Gérard-Libois, Jules; Julin, Malou; Mabille, Xavier (9 November 1984). Élections européennes en Belgique: géographie des votes de préférence [The European Elections in Belgium: Geography of the Preference Votes] (Report) (in French). Courrier hebdomadaire du CRISP. Retrieved 18 August 2025.
- ^ "José H.G. HAPPART". www.europarl.europa.eu. European Parliament. Retrieved 18 August 2025.
- ^ elected in the Socialist Party's Dutch list
- ^ Gérard-Libois, Jules; Julin, Malou; Mabille, Xavier (9 November 1984). Élections européennes en Belgique: géographie des votes de préférence [The European Elections in Belgium: Geography of the Preference Votes] (Report) (in French). Courrier hebdomadaire du CRISP. Retrieved 18 August 2025.
- ^ "Jef L.E. ULBURGHS". www.europarl.europa.eu. European Parliament. Retrieved 17 August 2025.