1939 Danish Folketing election|
|
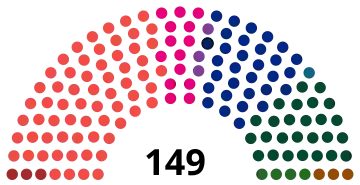
All 149 seats in the Folketing
75 seats needed for a majority |
|
This lists parties that won seats. See the complete results below. |
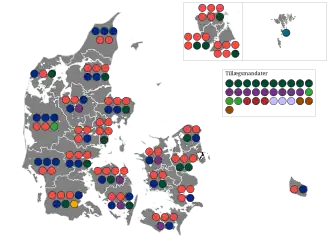
Folketing elections were held in Denmark on 3 April 1939,[1] except in the Faroe Islands where they were held on 19 April. They followed a dissolution of both chambers in order to call a referendum on changing the constitution. The referendum was held on 23 May but failed due to a low voter turnout. The result of the elections was a victory for the Social Democratic Party, which won 64 of the 149 seats. Voter turnout was 79.2% in Denmark proper and 47.8% in the Faroes.[2][3]
Results
 |
|---|
| Party | Votes | % | Seats | +/– |
|---|
| Denmark |
|---|
| Social Democratic Party | 729,619 | 42.92 | 64 | –4 |
| Venstre | 309,355 | 18.20 | 30 | +2 |
| Conservative People's Party | 301,625 | 17.74 | 26 | 0 |
| Danish Social Liberal Party | 161,834 | 9.52 | 14 | 0 |
| Farmers' Party | 50,829 | 2.99 | 4 | –1 |
| Communist Party of Denmark | 40,893 | 2.41 | 3 | +1 |
| Justice Party of Denmark | 33,783 | 1.99 | 3 | –1 |
| National Socialist Workers' Party | 31,032 | 1.83 | 3 | +3 |
| National Cooperation | 17,350 | 1.02 | 0 | New |
| Schleswig Party | 15,016 | 0.88 | 1 | 0 |
| Danish Unity | 8,553 | 0.50 | 0 | New |
| Total | 1,699,889 | 100.00 | 148 | 0 |
|
| Valid votes | 1,699,889 | 99.43 | |
|---|
| Invalid/blank votes | 9,667 | 0.57 | |
|---|
| Total votes | 1,709,556 | 100.00 | |
|---|
| Registered voters/turnout | 2,159,356 | 79.17 | |
|---|
| Faroe Islands |
|---|
| Union Party | 2,180 | 34.69 | 1 | 0 |
| Social Democratic Party | 1,353 | 21.53 | 0 | 0 |
| Business Party | 588 | 9.36 | 0 | New |
| Self-Government | 314 | 5.00 | 0 | New |
| Independents | 1,849 | 29.42 | 0 | 0 |
| Total | 6,284 | 100.00 | 1 | 0 |
|
| Valid votes | 6,284 | 99.62 | |
|---|
| Invalid/blank votes | 24 | 0.38 | |
|---|
| Total votes | 6,308 | 100.00 | |
|---|
| Registered voters/turnout | 13,197 | 47.80 | |
|---|
| Source: Danmarks Statistik |
References
.svg.png)